Gold is in a new bull market — see important charts
Gold (priced in Swiss Francs) has begun the next leg of its bull trend
As many of you know I use the Gold/Swiss Franc ratio as a leading indicator of the price of Gold. This indicator can be used to trade Gold against the U.S. Dollar or directly against the Swiss Franc in a USD-neutral trade.
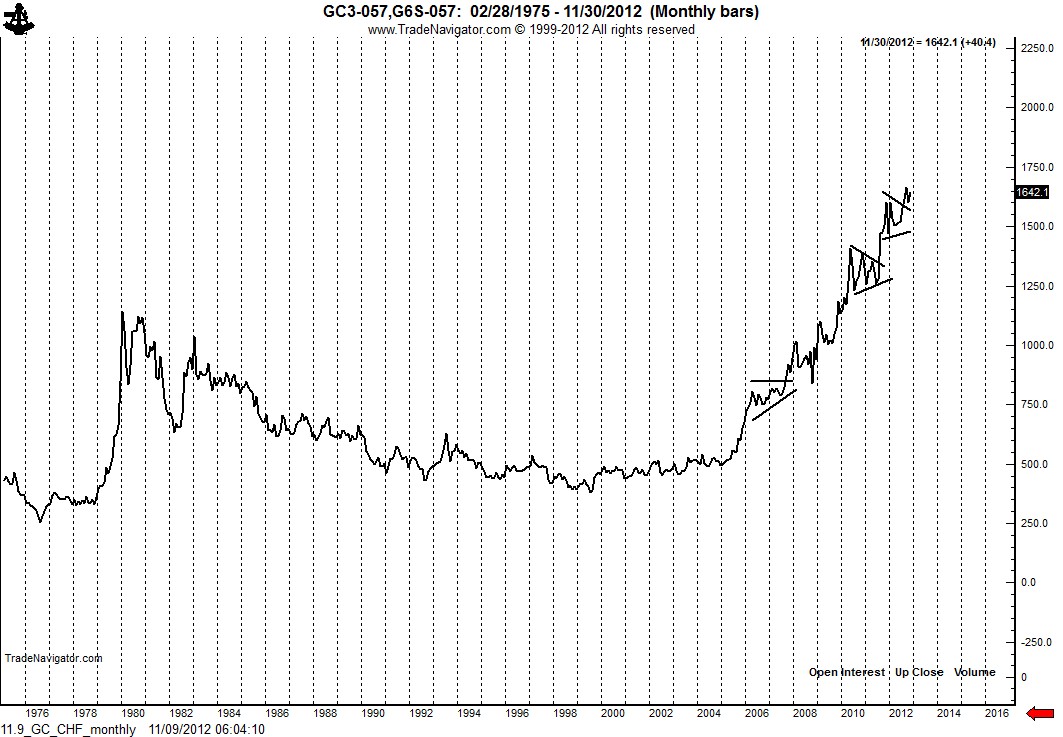
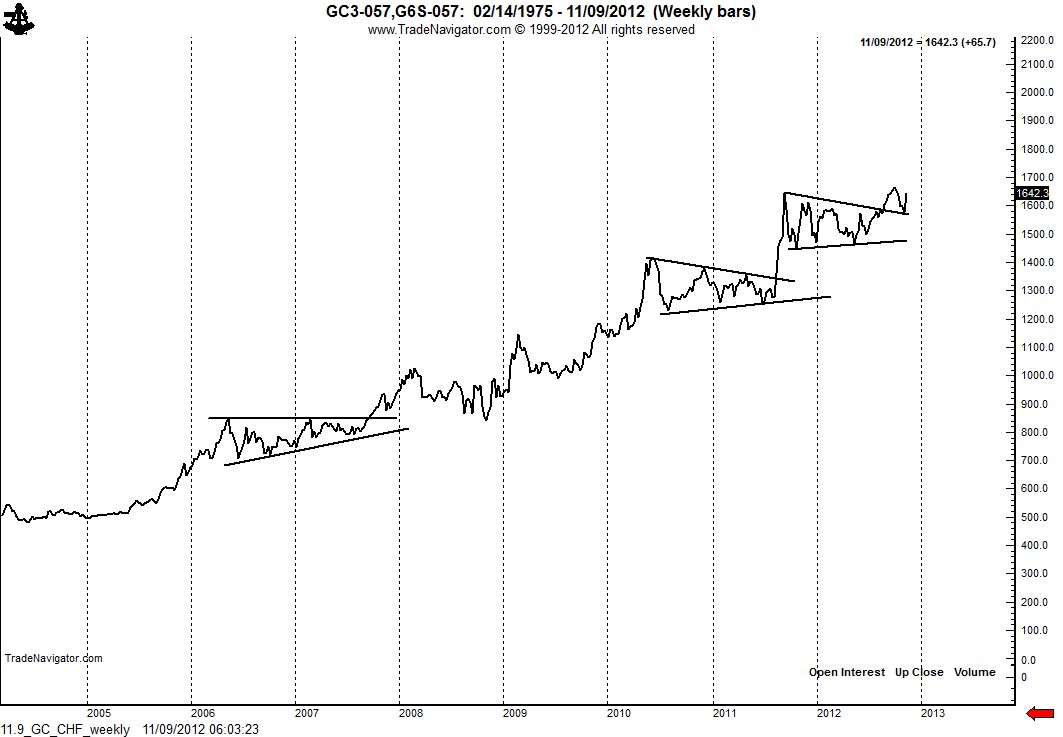
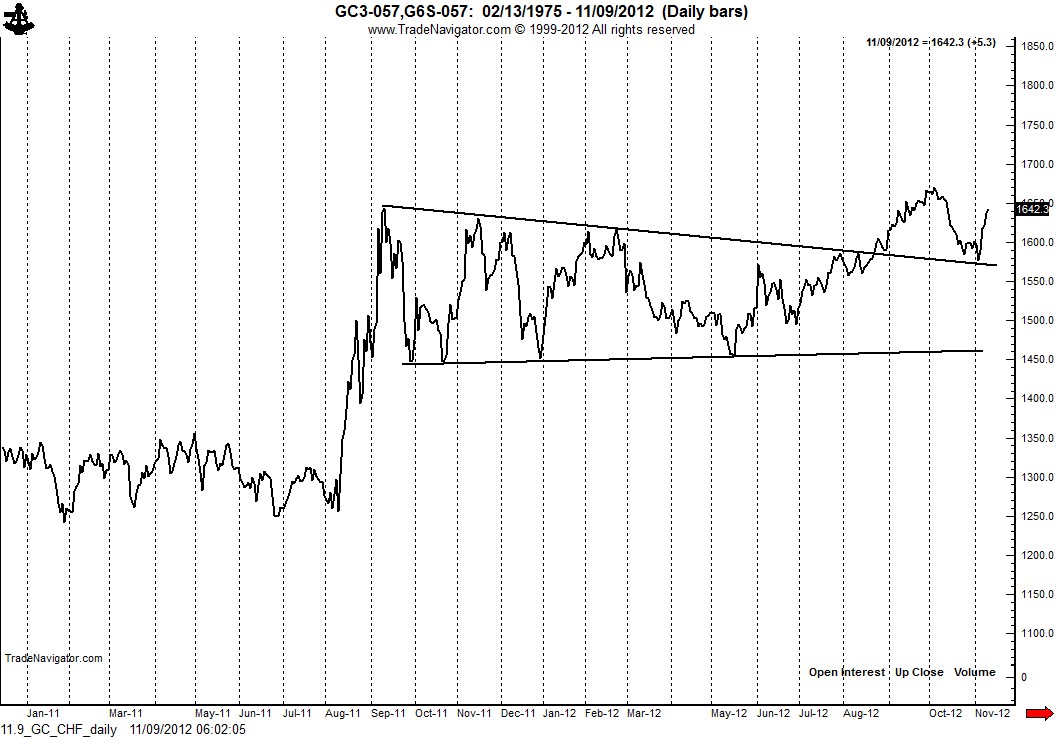
The monthly, weekly and daily charts of the Gold/CHF ratio conclude the following:
- The longest-term trend (monthly) remains solidly up
- The medium-term trend (weekly) has a history of developing congestion areas prior to each new advancing thrust
- The daily graph completed a 12-month symmetrical triangle in August. The October break in Gold simply retested the upper boundary of this triangle. This retest appears to be over — and the next advancing trend in Gold has likely begun. Only a close below the November low on the daily chart would cause me to rethink this interpretation.
The Gold/CHF ratio has a target of CHF 1,800.
Markets: $GC_F, $USDCHF, $6GS_F, $GLD
###


Trackbacks & Pingbacks
[…] Read Brandt’s short and sweet take here, including the aforementioned charts. […]
[…] Gold is in a new bull market — see important charts Peter L. Brandt […]
Leave a Reply
Want to join the discussion?Feel free to contribute!