Market Review
Factor Moves are currently ongoing in:
- Gold
- Japanese Yen
- USD/NOK
- Copper
- AUD/NZD
A Factor Move was terminated in AUD/NZD. A Factor Move is developing in USD/SEK and New Zealand Dollars. This issue of the Factor also comments on the Soybean complex, Euro, Heating Oil, Canadian Dollars and global stock markets.
Factor Moves in Progress
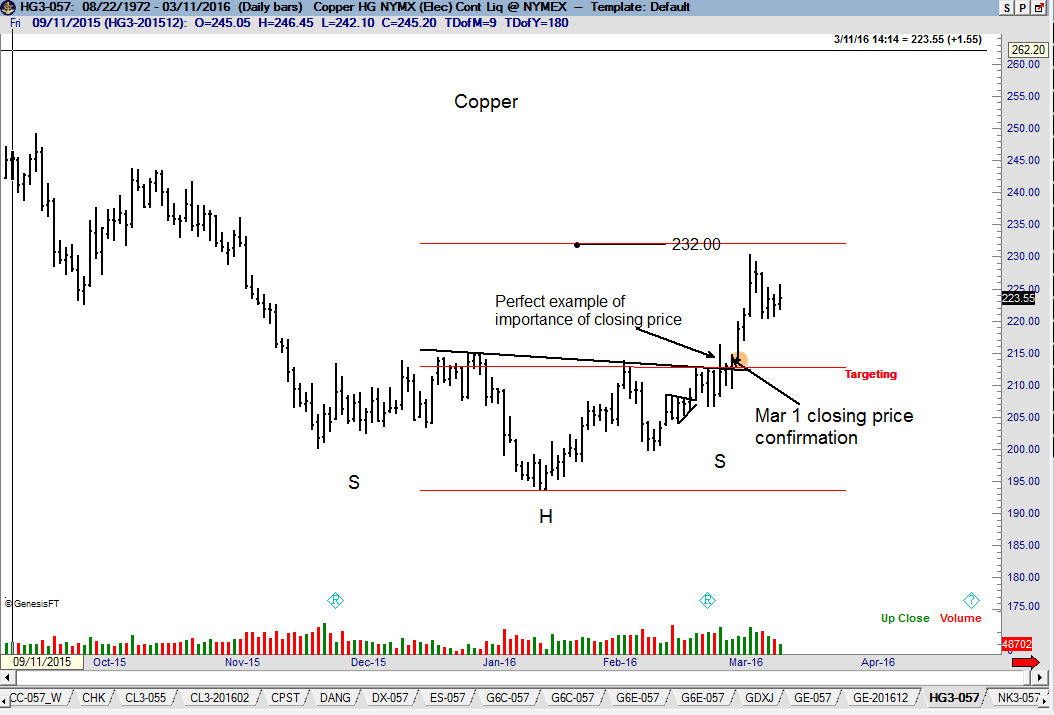
Copper (daily chart)
After falling from a high of 465 in Feb 2011, it appears that Copper bottomed at 193.55 on Jan 18. The advance on Mar 1 confirmed a H&S bottom. I have upped the initial price target to 231.90. An eventual test of the Oct 2015 high at 244 is likely. Factor is long one layer.
 Read More