Tag Archive for: H&S

Factor Report Special Paper, March 7, 2021 — The Head and Shoulders Pattern

This content is for members only

The Head and Shoulders Pattern

This content is for members only

The Hierarchy of Chart Reliability

This content is for members only

H&S failure

This content is for members only
Is it a massive Natural Gas Head Shoulders bottom - Factor trading - Peter Brandt

Is it a massive Natural Gas Head & Shoulders bottom?

Is it a massive Natural Gas Head & Shoulders bottom?

I last covered the Natural Gas market within the public blog back on June 20th, with the post "Natural Gas Rising".  Natural Gas posted a 21-year price low in Mar 2016 and the bottom took the form of a 7-month Natural Gas Head & Shoulders bottom on the daily and weekly charts. The target of this H&S at 2.934 was quickly met on Jun 29. The Factor participated in this H&S pattern in its proprietary account and discussed the pattern within the Factor member Updates (See here for details on the Factor Service).
 
Natural Gas Head & Shoulders - Monthly chart - Factor Trading
Read More

Natural Gas — A massive H&S bottom?

Natural Gas posted a 21-year price low in Mar 2016, as shown below on the quarterly graph. 1
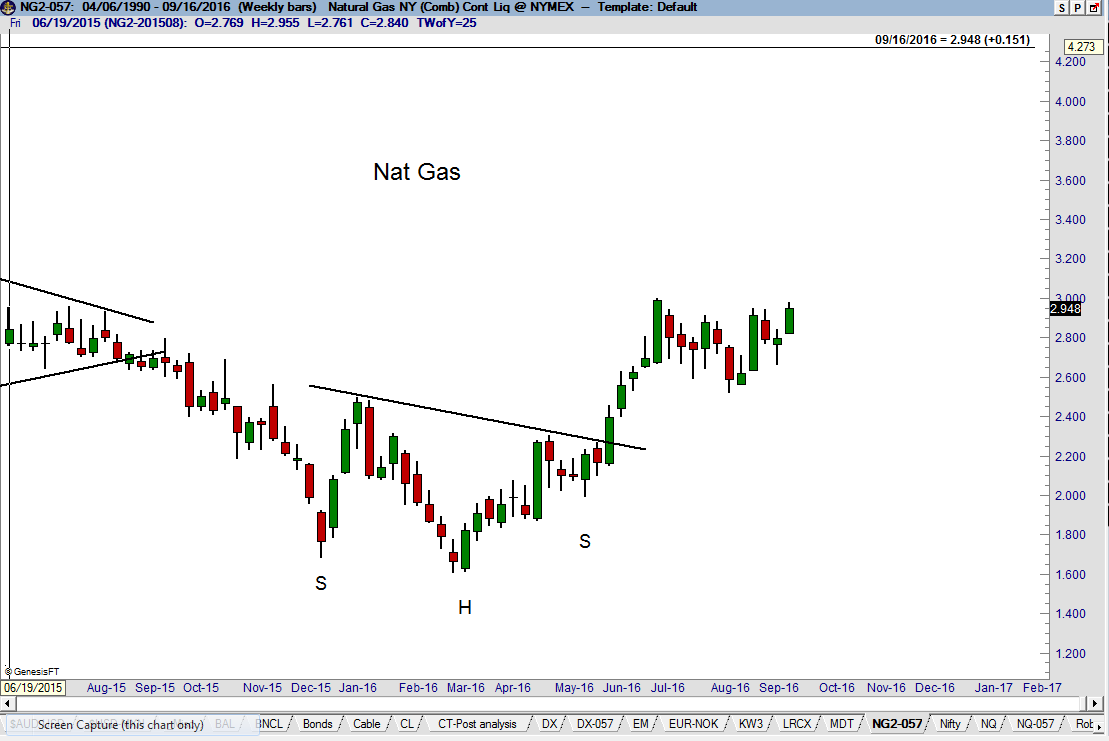
The bottom took the form of a 7-month H&S bottom on the daily and weekly charts. The target of this H&S at 2.934 was quickly met on Jun 29. The Factor participated in this H&S pattern in its proprietary account and discussed the pattern in the Factor Update.
Read More

Factor Interim Update – September 1, 2016

This content is for members only

An example of morphology plays itself out in Soybeans

This content is for members only

BNCL and general stock market strength

This content is for members only

Some misc. stocks plus Cotton

This content is for members only