

Is it a massive Natural Gas Head & Shoulders bottom?
Is it a massive Natural Gas Head & Shoulders bottom?
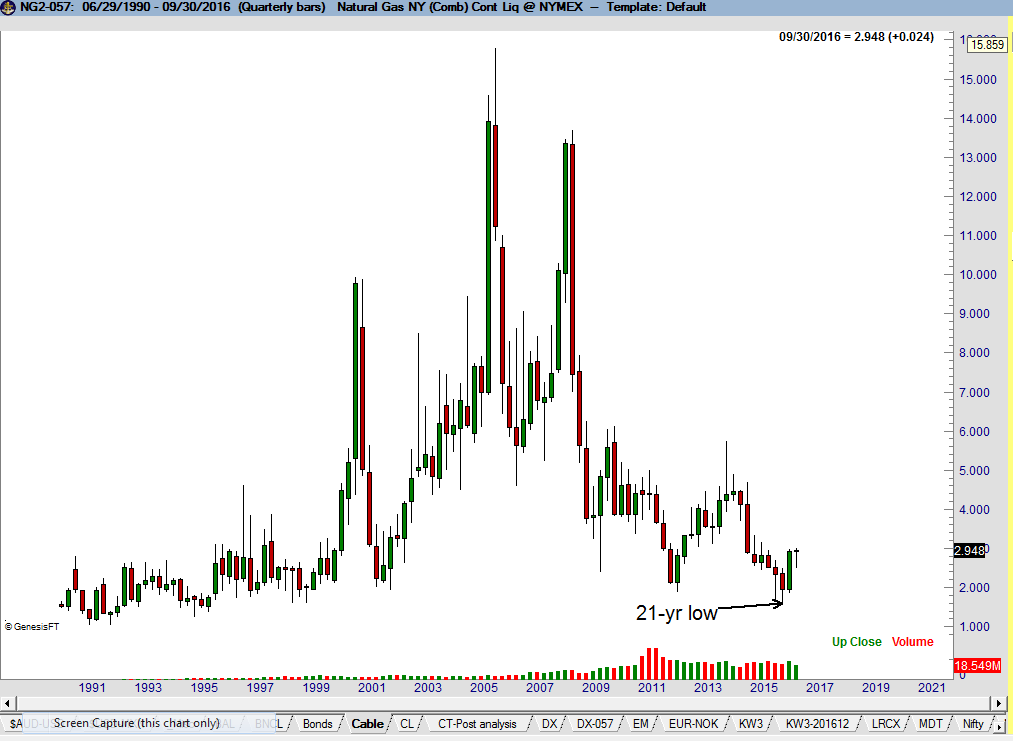
I last covered the Natural Gas market within the public blog back on June 20th, with the post "Natural Gas Rising". Natural Gas posted a 21-year price low in Mar 2016 and the bottom took the form of a 7-month Natural Gas Head & Shoulders bottom on the daily and weekly charts. The target of this H&S at 2.934 was quickly met on Jun 29. The Factor participated in this H&S pattern in its proprietary account and discussed the pattern within the Factor member Updates (See here for details on the Factor Service).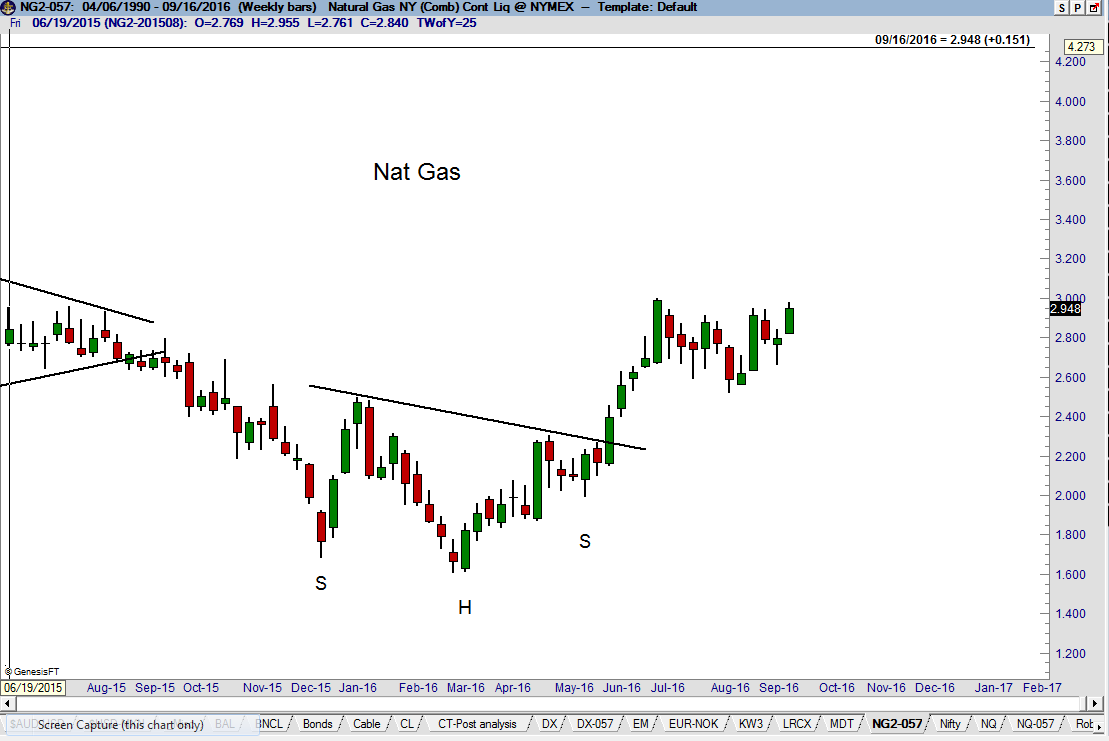

 The bottom took the form of a 7-month H&S bottom on the daily and weekly charts. The target of this H&S at 2.934 was quickly met on