Putting the current bear markets in Gold and Silver into a longer-term perspective
Silver bulls may eventually be right, but they are still idiots.
By contrast, Gold bulls represent — by and large — a thoughtful group of folks.
As a trader and blogger, I love to have fun at the expense of Silver bulls. No other market I trade has a larger and more obsessed cult following of non-thinking and emotional “investors.”
I tend to be a Bayesian thinker. In my career as a trader dating back to 1976 I have found that most really good traders are Bayesian, whether they even know the term. No way could a logical Bayesian buy into the nonsense believed by Silver bulls. In mean, these are people who believe the Gold/Silver ratio should be 15 to 1 because it was so proclaimed by some Spanish king 500 years ago!
The daily and weekly graphs of Gold and Silver indicate that lower prices are most likely. Key chart levels are giving way, calling for a possible sharp drop from current prices. Let’s review these charts.
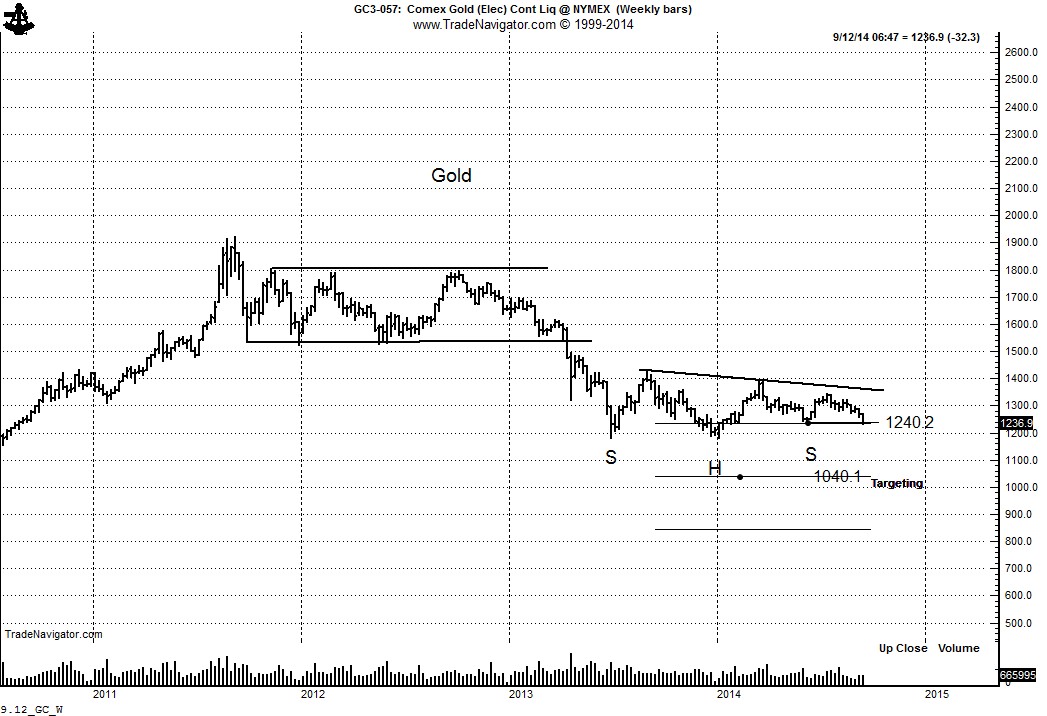
The weekly Gold chart is attempting to complete a 15+ month H&S failure pattern. A decisive close below 1240 will complete this chart configuration and indicate a possible target at low as 1040. HERESY! … the Gold bulls proclaim. It must be market manipulation — after all, the destiny for Gold is $5,000 per oz.
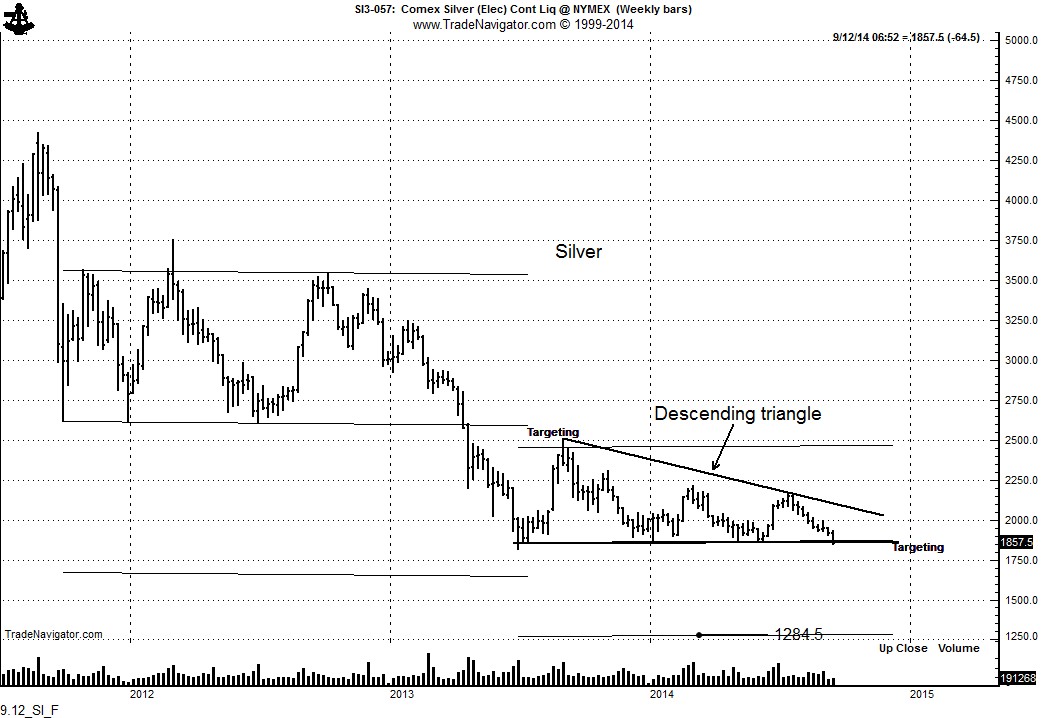
The weekly Silver chart is challenging the lower boundary of a descending triangle. A decisive completion of this pattern would indicate a target of 12.85. ABSOLUTE HERESY OF THE FIRST ORDER! THE GLOBE IS OFF ITS AXIS!!! This cannot happen. Impossible. After all, the cost of mining is $15 or $25 or whatever per oz. Let me say this once clearly for you Silver suckers — the cost of production means nothing. Who cares if small marginal cost-of-production miners shut down. It means nothing. It would take years and years of low prices for the big miners to shut down.
While the weekly and monthly charts are negative, Gold and Silver can be viewed from an ever larger historical perspective. Keep in mind, many a trader has gone broke with the correct longest-term historical perspectives. Historical perspectives are good for understanding, but not for timing investing and trading.
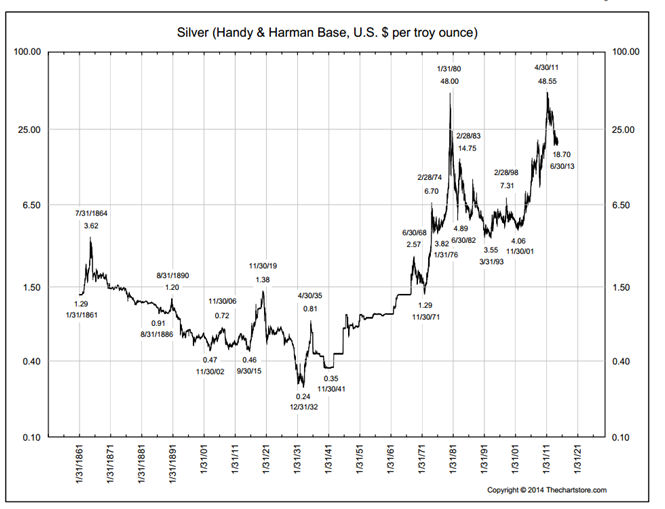
It can be argued that the longest-term trend is arguably up in Silver on the basis of this 100+ year chart.
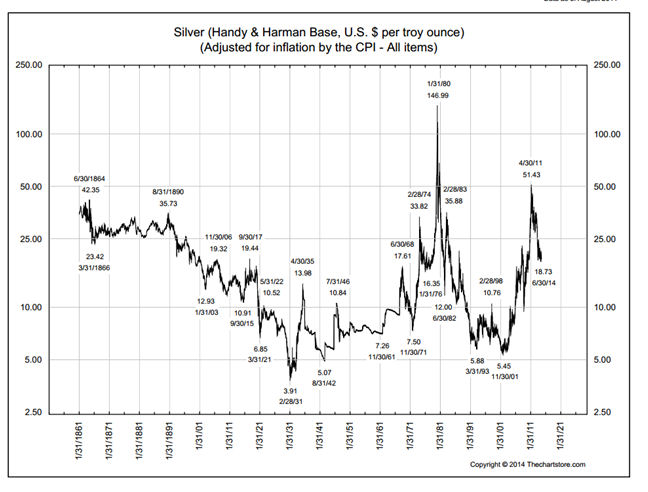
Silver could drop all the way back to $6 to $8 and remain in a long-term bull trend. There is one other chart of Silver worthy of display — the price of Silver adjusted for inflation (i.e., purchasing power as a function of “fiat” money). On this chart we see that Silver is right in the middle of a 100-year trading range — and in fact, has spent many more years in the past century below the current price than above the current price.
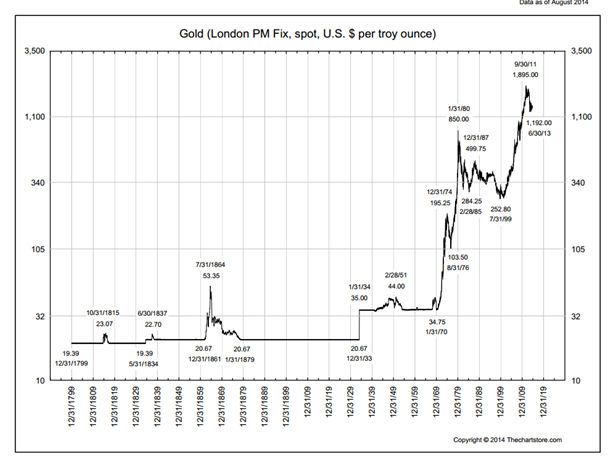
The 200-year chart of Gold shows a different picture than that of Silver. Gold is in a genuine “for real” historic bull market.
There is a reason for the different “look” of the longest-term Silver and Gold charts — and you Silver bugs are not going to like what I say. Gold is a precious metal and store of value. Gold is actually a real investment medium. Silver is primarily an industrial metal (75% of annual Silver supply is off-taken for industrial uses). You can go ahead and argue with my statistic based on data provided to you in the latest report titled, “Why Silver Will Triple in Price in the Next Five Years,” published by some company that wants to charge you an arm and leg premium over spot prices to sell you coins from some “limited supply, one-time-only” Donald Duck release. But, my figure is right and their figure is wrong.
I actually believe in the long-term prospects for Gold. I think prudent people should be accumulating physical Gold during this bear market and sticking it in their safety-deposit boxes. As for Silver … no interest.
Please click here to read a copy of “The History of Gold Prices” updated late in 2013.
Markets: $GC_F, $GLD, $SI_F, $SLV, $GDX
Note: This perspective represents the type of analysis and thinking delivered on a regular and timely basis to members of the Factor email service. For information on this service, click the “Subscription” tab in the upper menu bar.
###



Leave a Reply
Want to join the discussion?Feel free to contribute!