Soybeans — Get ready for a price explosion!
Bear trap on July 25 sets the stage for a major breakout
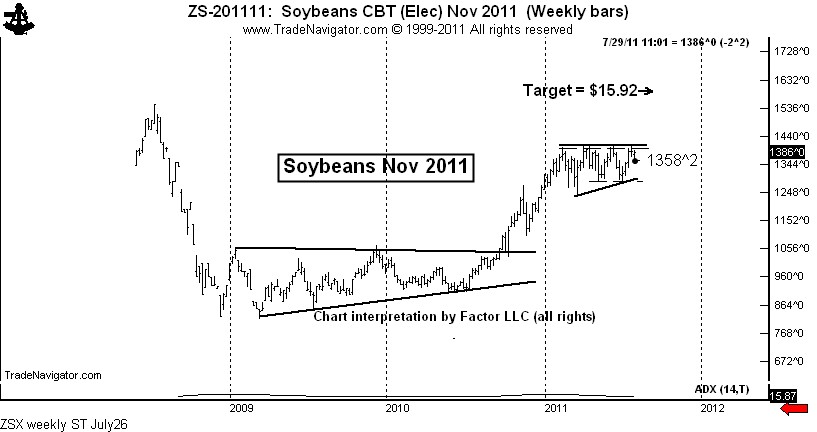
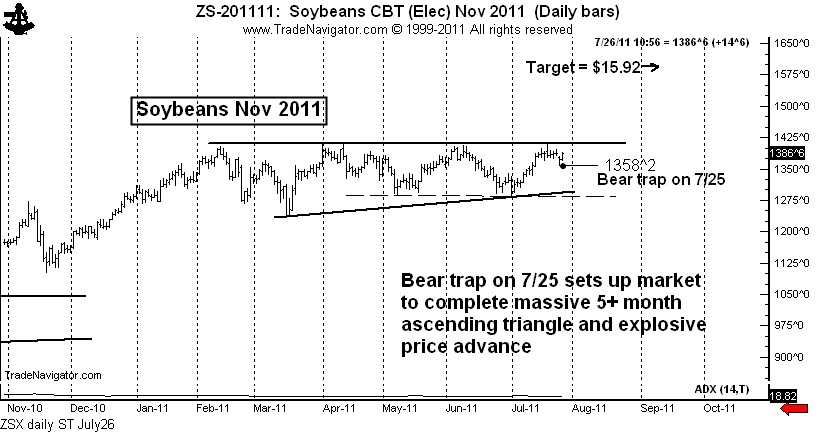
The 5-plus month ascending triangle in Soybeans is on the verge of a breakout. The key to this market may be the gap down on July 25 and the subsequent covering of this gap today, July 26. The weekly chart below shows the big picture in the November Soybean contract.
A strong close today would indicate that the July 25 decline was a wash-out bear trap. Weak longs exited their positions and will now need to “pay up” to get back into the market.
The completion of this pattern (see daily chart above) would set the stage for an advance to at least $15.92. Note on the daily chart the lower dashed line, marking the lower boundary of a 4-month rectangle, and the upper dashed line, marking the closing prices.
A close above 14.00 or decisive move above 14.18 would complete this pattern. Caveat – there is always the possibility that a breakout would be the ultimate bull trap.
This is as clear and precise as any chart set-up I have seen in a number of months.
Markets: $ZS_F $RJA


Trackbacks & Pingbacks
[…] charts on commodities seems kind of foolish to me Soybeans — Get ready for a price explosion! | PeterLBrandt if anything, their technicals are the easiest things to […]
Leave a Reply
Want to join the discussion?Feel free to contribute!