Tag Archive for: AAPL

Factor Update, February 16, 2019

 
Update in Review
 
Current Factor Tracking Account Positions
  • Long Soybean Oil futures
  • Long AAPL (stock)
  • Short KC Wheat futures
  • Long IPE Gas Oil futures
  • Long Sugar futures
  • Long GLD (etf)
  • Current portfolio leverage = 1.0X
  • Capital utilization = 30.0%
  • Closed trades this past week = nil (YTD = +4.4%)
Markets under considerations for possible trades  
  • GOLD (etf)
  • Sugar futures
  • NVDA
###
plb

Factor Update, February 9, 2019

Update in Review

Current Factor Tracking Account Positions
  • Long Soybean Oil futures
  • Long AAPL
  • Positions closed this past week = +.8% (YTD = +4.29%)
  • Current portfolio leverage = .25X
  • Capital utilization = 6.9%
Markets under review for possible trades
  • Corn futures
  • GOLD (stock)
  • Gold futures
  • CHF/JPY spot
  • Sugar futures
plb
###

Factor Abbreviated Update, February 1, 2019

Update in Review 

Current Factor Tracking Account Positions
  • Long Gold futures
  • Long Soybean Oil futures
  • Long BAP
  • Long AAPL
  • Trades closed this past week = +17 BPs (YTD = +3.5%)
  • Portfolio leverage = 1.34X
  • Capital utilization = 40.6%
Markets under review for possible trades
  • Jul Corn
  • European Milling Wheat
plb
###

Factor Update, January 26, 2019

Update in Review

 
Current Factor Tracking Account Positions
  • Long Soybean Oil futures
Markets Under Review for Possible Trades
  • Long Corn futures
  • Long European Milling Wheat
  • Long spot GBP/NOK
  • Long Soybeans futures
  • Long BAP
  • Long AAPL
  • Long Gas Oil futures
  • Long Gold — ETFs or futures
Enclosures:
Factor symbol list as of Jan 25, 2019

Factor Update, November 3, 2018

Update in Review
 
Current Factor Tracking Account Positions
  • Short EuroSwiss rate futures
  • Short T-Bond/T-Note futures spread
  • Current leverage = Nil (I do not calculate the nominal value of interest rate futures to determine account leverage
  • Capital utilization = 4.0%
  • Closed trades since last Update = 1.0% (YTD = 60.6%)
Markets under consideration for possible trades
  • Bitcoin
  • Silver futures
  • Copper futures
  • EuroSwiss futures
 
plb
###

Factor Update, January 7, 2018

Update in Review
Current Factor Tracking Account Positions
  • Long Eurodollar spread — will be exiting
  • Long spot EUR/JPY
  • Short EuroSwiss rate futures
  • Short spot USD/CAD
  • Short US Dollar Index futures
  • Long FTSE
  • Long Osaka Nikkei futures
  • Long Ethereum
  • Long SGG (Sugar ETN)
  • Closed trade P /L for past week = + 1.1% (+1.1% YTD)
  • Portfolio leverage = 1.5X
The focus on my attention this coming week
  • Monitoring Sugar futures for buy signal
  • See others in Update
plb
 ###


Apple Computer– markets are nothing but a bunch of maybes


NOTE: 

This is a post from March 26th.  An automated email was mistakenly sent regarding this post.  Sorry for the inconvenience.

Apple Computer released news of the first quarterly sales drop since 2003 moments ago. I will suggest a “possibility.” Remember, markets are nothing but possibilities. The world of maybes is the world traders must all call home.

Is it possible for the Apple to fall from the tree?

First, see the semi-log quarterly graph of Apple Computer as a publicly traded company. Back adjusted for splits, the stock traded as low at $.17 — that’s 17 cents.
The weekly and daily charts now exhibits one of my favorite chart patterns — the descending triangle (dating back to the 2015 low).
By all early indications, AAPL will experience a large down gap tomorrow. AAPL is trading in the after-market around 96.52. A favorite trade of the day traders will be to buy AAPL tonight or tomorrow believing that the stock will fill the opening gap at some point in the days ahead. Will they be right? Who knows.
A close below $89 would complete this descending triangle and indicate a possible decline to $51. Am I likely to sell a downward breakout in AAPL? Not likely at all. I am less likely to buy AAPL expecting the gap to be easily filled.
I am really featuring a perspective on AAPL knowing that tomorrow will be one wild ride.
plb
###

Some shorter-term charts that are ready to move

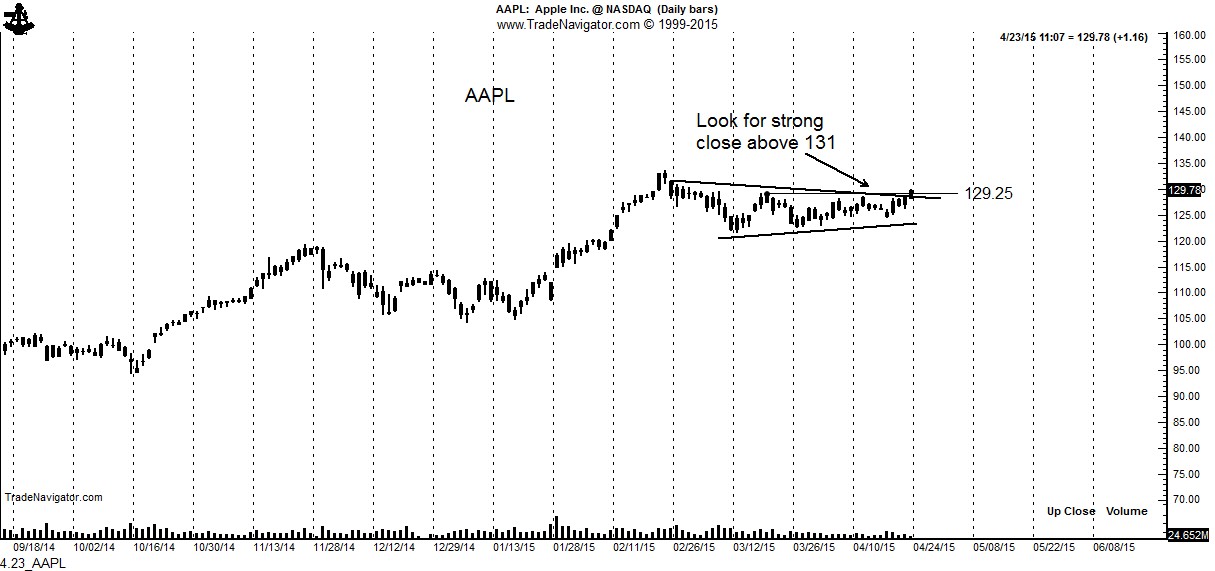
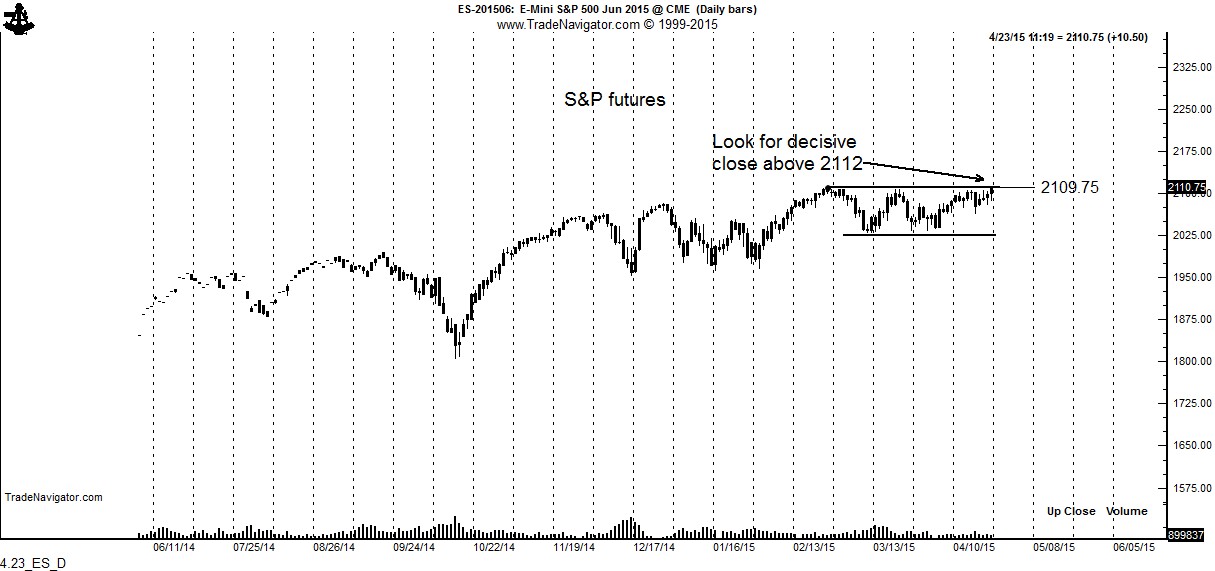
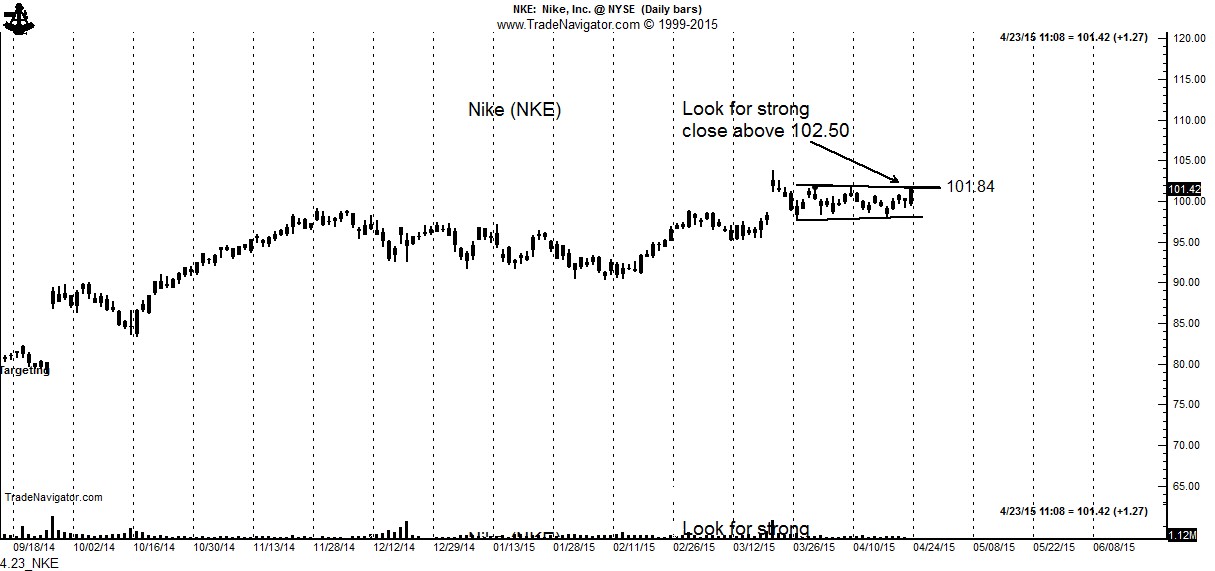
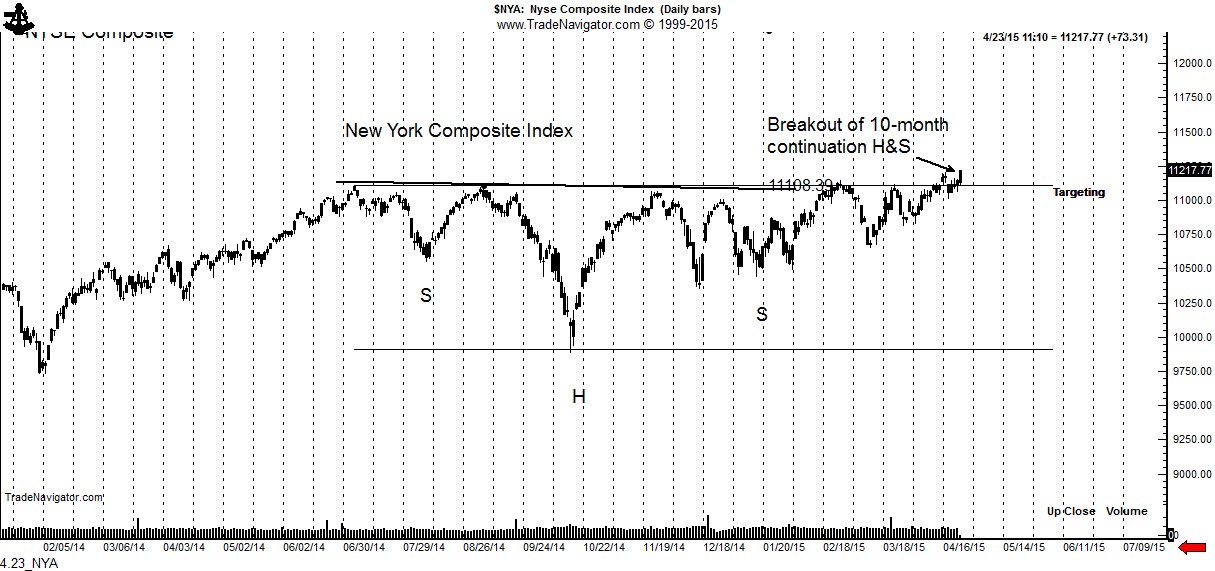
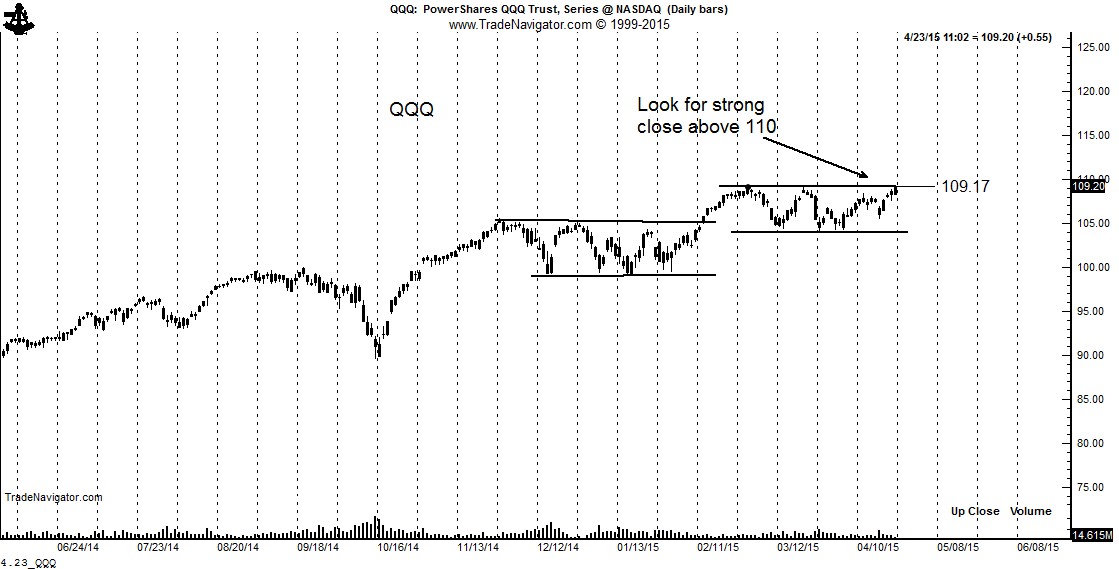
Nasdaq ($NQ_F, $QQQ), S&Ps ($SPX, $ES_F), Apple ($APPL), NYSE Composite Index ($NYA) and Nike ($NKE) appear ready for a strong advances

Hey all you stock market bears, get prepared to fade these breakouts!


4.23_AAPL 4.23_ES_D 4.23_NKE 4.23_NYA 4.23_QQQ

Analyses of these charts — and many others — are routinely provided to members of the Factor Email Service (see upper menu bar)


###


Apple and a history of head and shoulder patterns


The H&S pattern has served an important role in the turning points of $AAPL in recent years

The H&S pattern — when properly identified — is the most reliable of all classical chart patterns. Unfortunately novice market analysts are way to quick to mislabel market action as a H&S configuration.

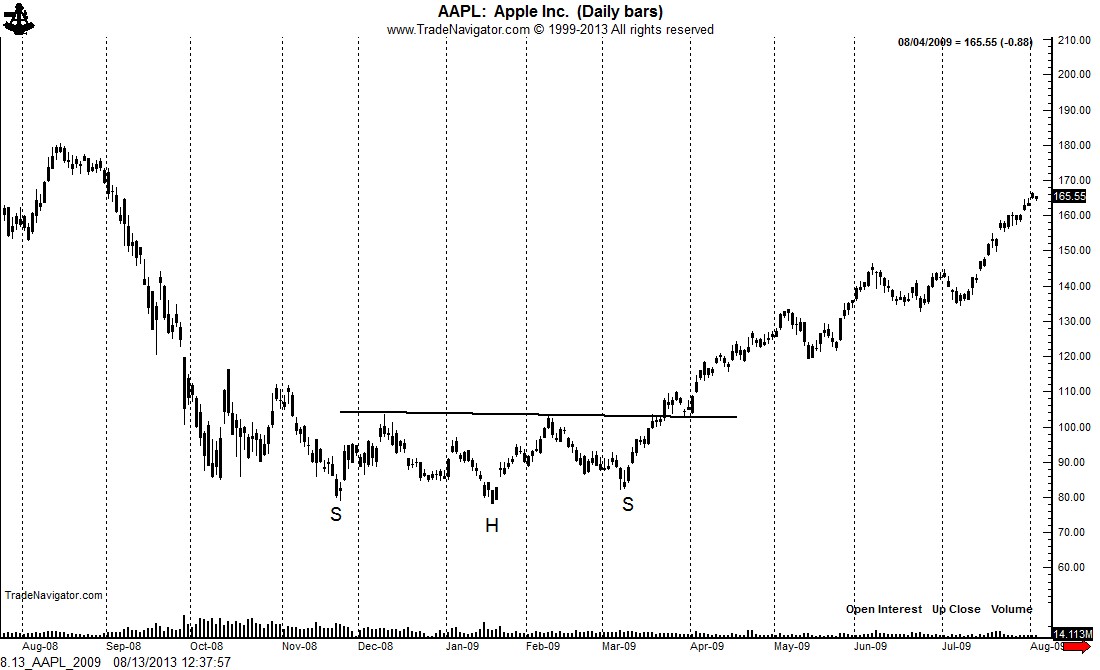
The H&S pattern has served as the key turning point in $AAPL since the March 2009 low. The first chart below shows the classic H&S bottom completed in March 2009. This pattern launched a $600 rally.

8.13_AAPL_2009

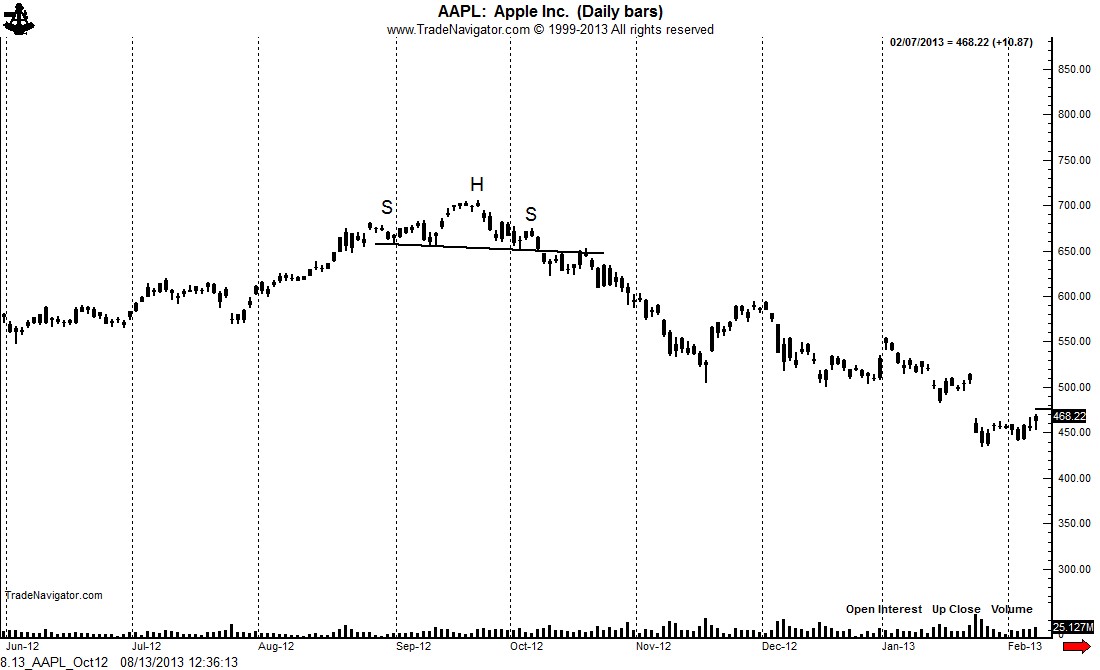
The late 2012 top took the form of a small H&S top. It is not unusual for H&S tops to be brief, whereas H&S bottom patterns tend to be much longer in duration.

8.13_AAPL_Oct12

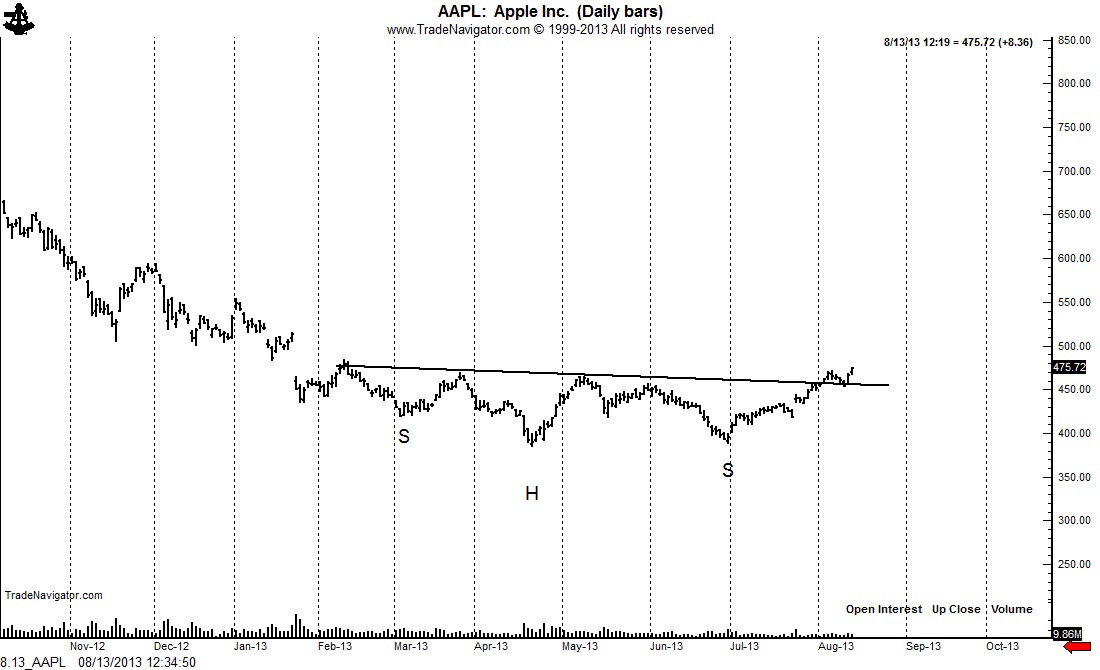
The rally in AAPL today confirmed a 6-month H&S bottom. It appears as though the long-term bull trend in AAPL has re-emerged. The intial target of this pattern is $545. A close below $425 would negate this interpretation.

8.13_AAPL


$AAPL


###

A chart update on the metals, other markets


Markets are fast approaching chart targets


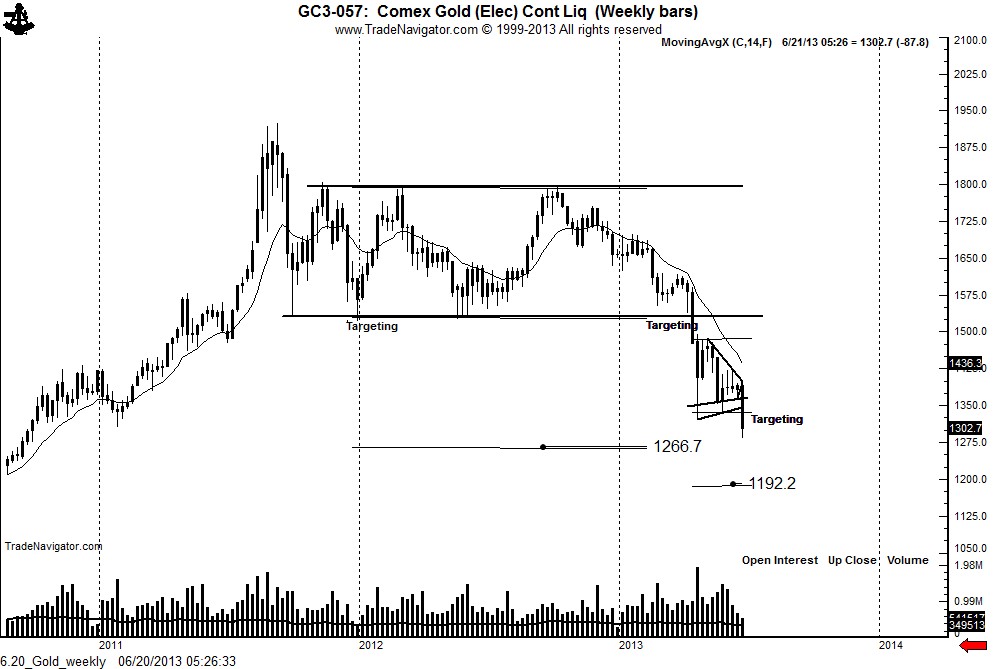
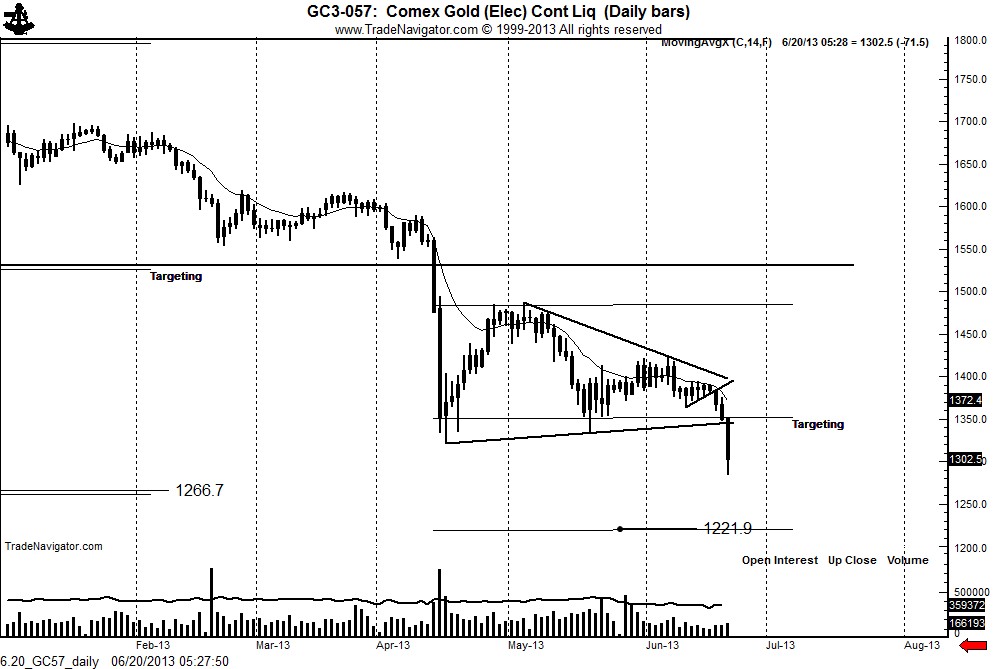
The weekly Gold chart is well on its way to the target of 1266 establsihed by the April completion of a 19-month rectangle. The daily chart has now completed a continuation 9-week triangle. This triangle has a further target of 1221.
6.20_Gold_weekly

6.20_GC57_daily

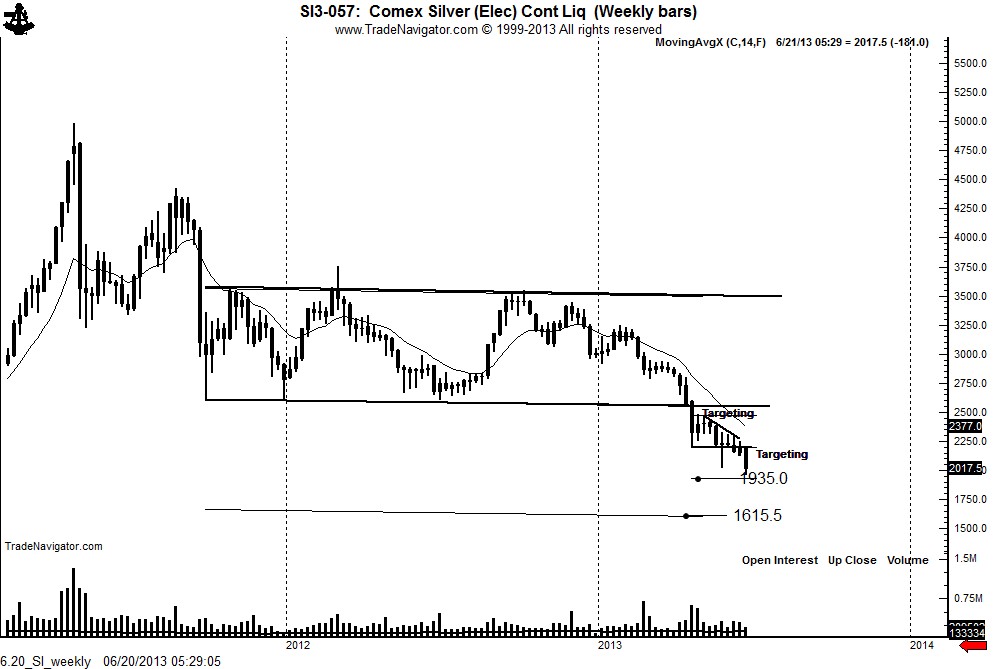
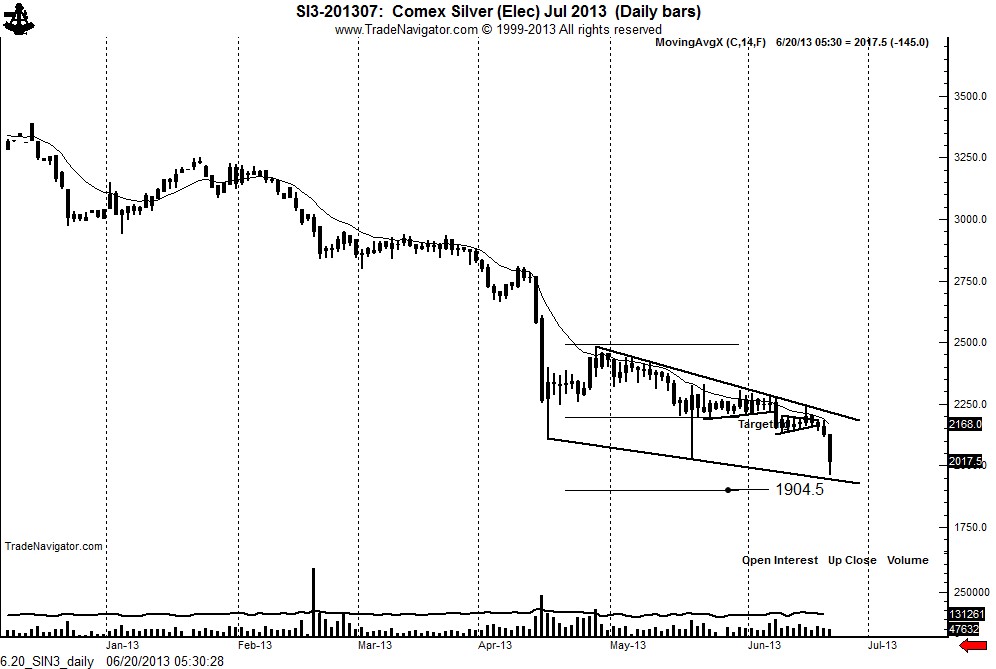
The weekly Silver chart has a target of 1615 established by the April completion of an 18-month rectangle. The daily chart is forming a possible wedge pattern. My guess is that this wedge pattern will serve as a launch to the final low in this bear market.
6.20_SI_weekly

6.20_SIN3_daily

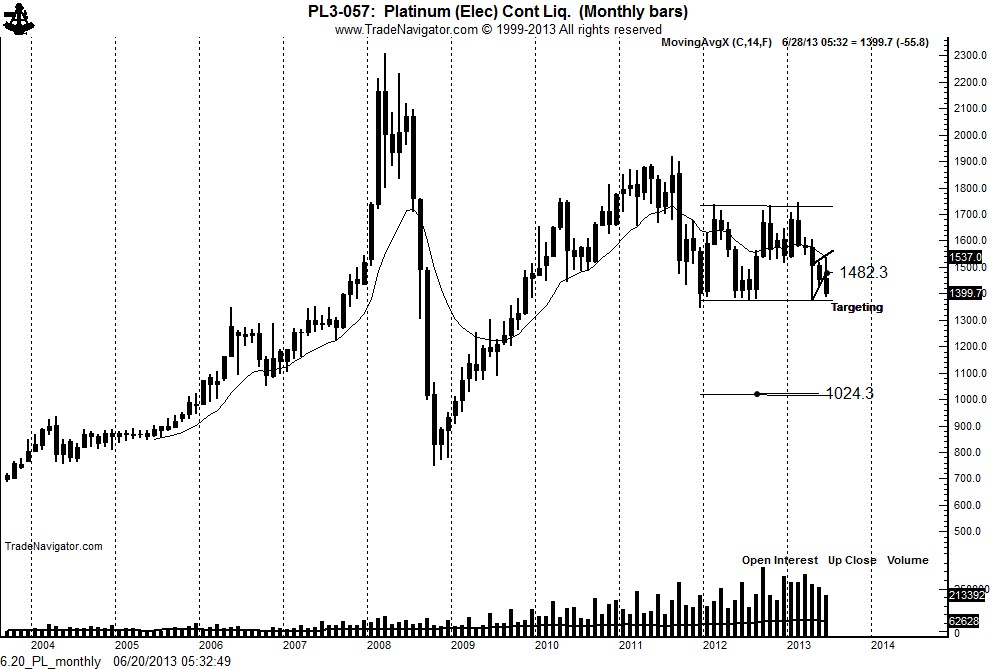
The montly Platinum chart displays an 18-month rectangle. Should this rectangle be decisively resolved by a downside breakout the target would become 1024.
6.20_PL_monthly


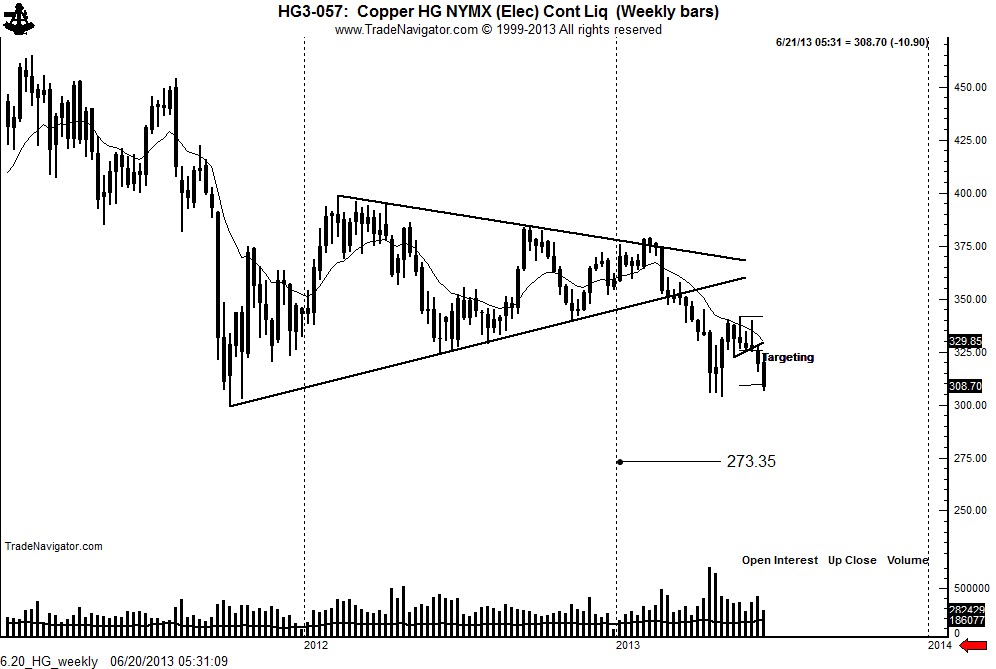
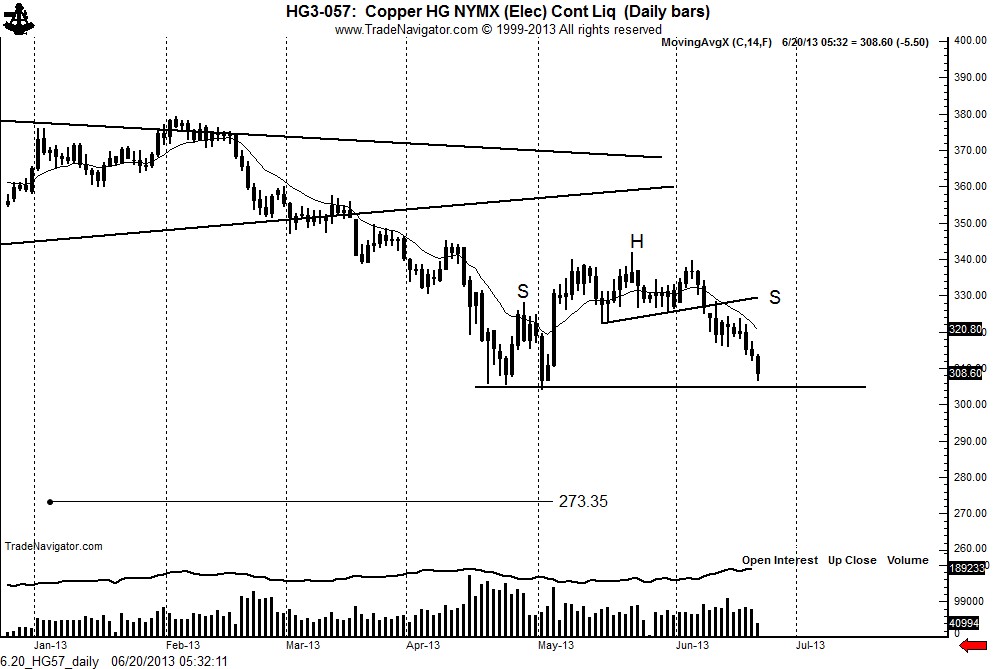
The dominant pattern in Copper is the completion on the weekly chart of an 18-month symmetrical triangle in March. This pattern has a target of 273. My guess (or perhaps my hope) is that the daily chart will hold at the April low and a rally back toward 320 to 325 will occur. This would set up the possibility of a continuation H&S pattern. However, we would need a right shoulder rally for this to occur.
6.20_HG_weekly

6.20_HG57_daily

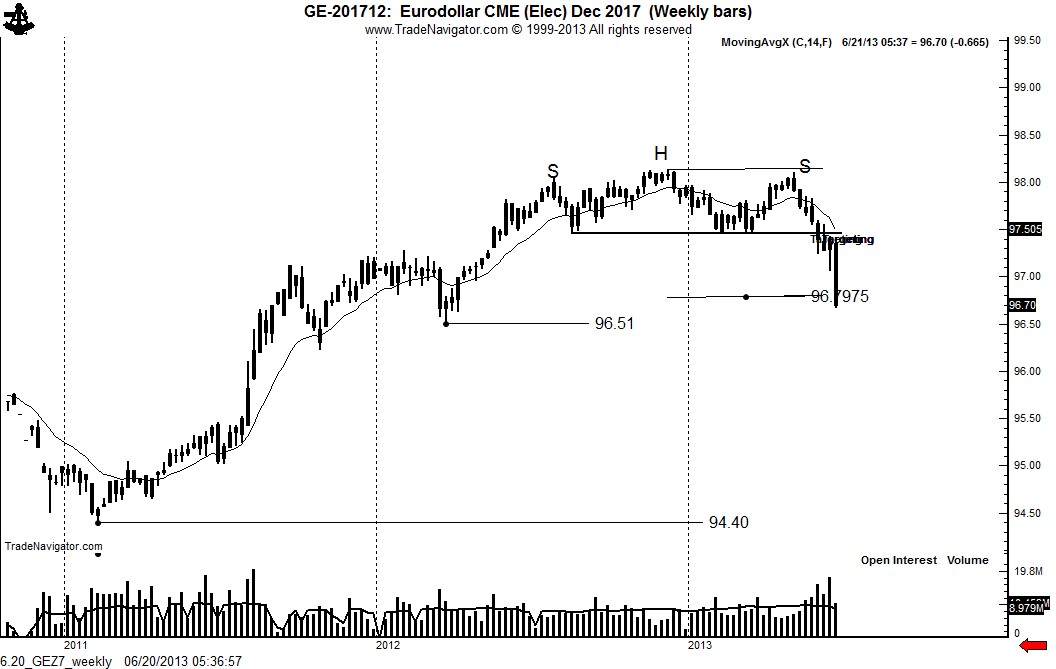
The target of the weekly and daily H&S top in the Dec. 2017 Eurodollars has been met. Meeting a downside target is not a reason to become a bull. A major trend change has taken place in the interest rate markets. Further downside targets exist at 96.51 and 94.40. The 94.40 target (representing an interest rate of 5.6%) is probably a year or so away.
6.20_GEZ7_weekly

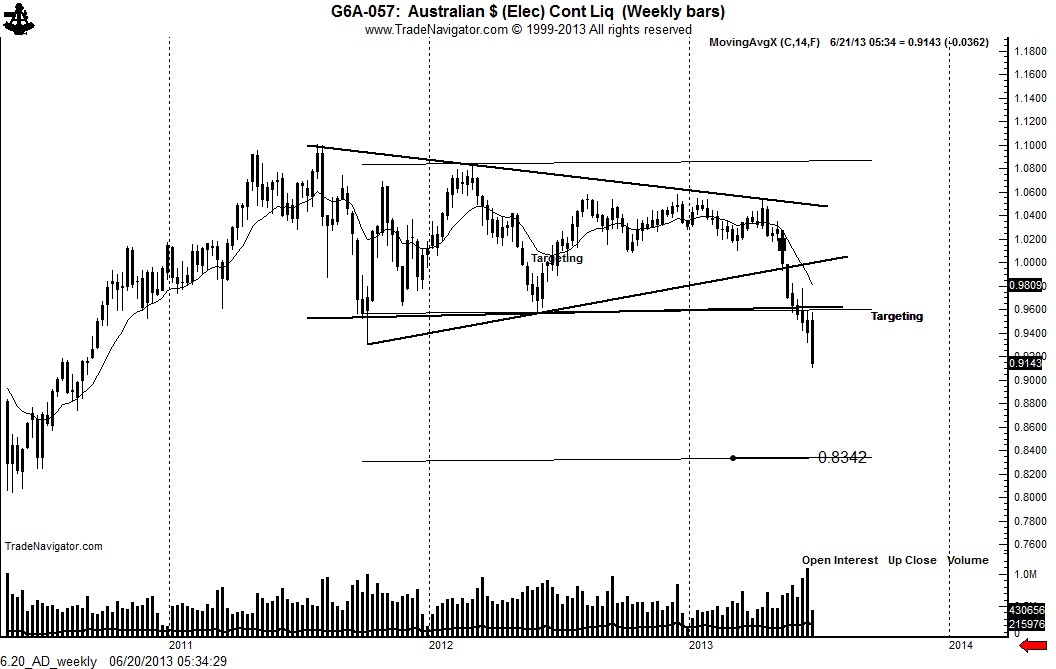
The bearish implications of the completion of the 2-year symmetrical triangle on the weekly Australian Dollar chart cominue to play out. The target in this market is .8342. Do not rule out a period of congestion and short-covering strength along the way.
6.20_AD_weekly

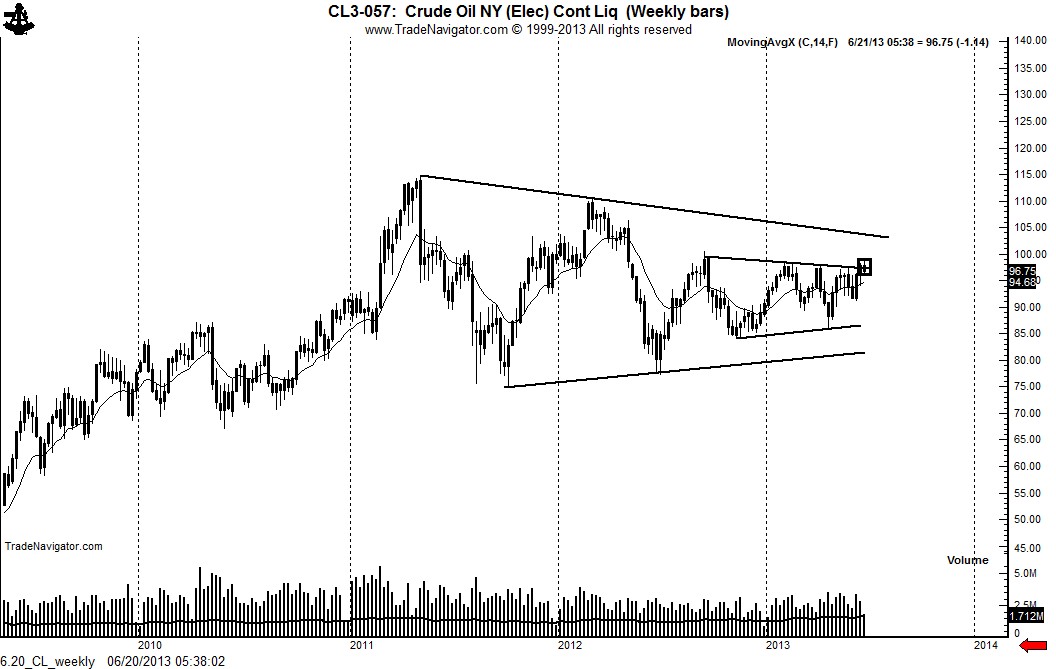
I am quite certain that the brief completion in recent days of the 10-month “triangle within the triangle” on the weekly Crude Oil chart will prove to be a giant bull trap (yes, for the record, I got nipped for 65 points). Yet, the bear trap is not yet official. A full bar close below the upper boundary of the triangle is required to spring the trap.
6.20_CL_weekly

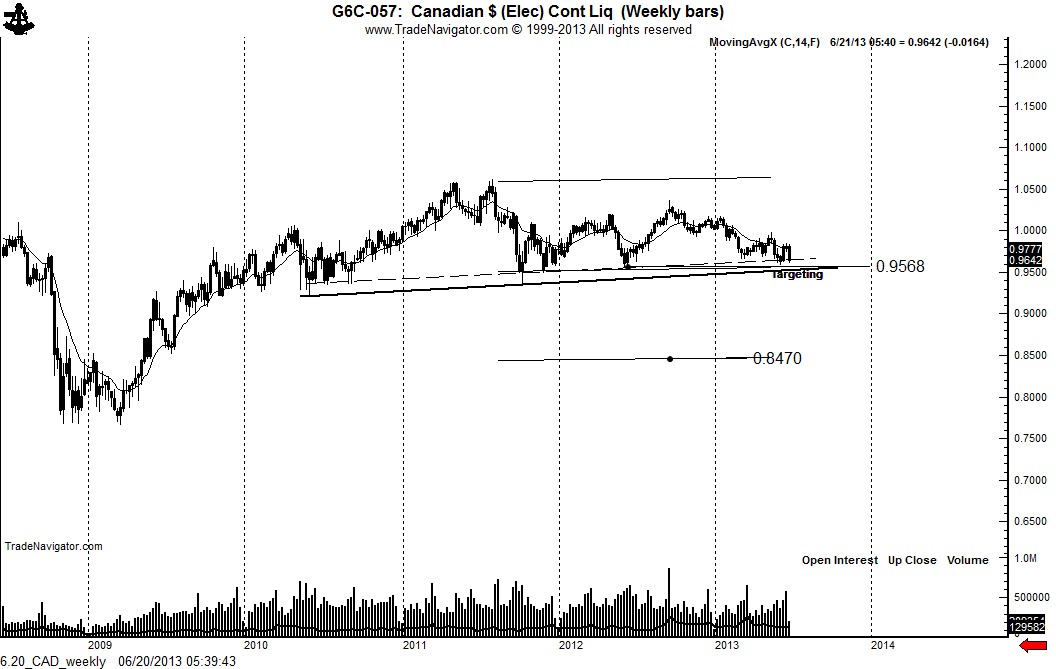
Allow me to whet your appitite with a weekly chart of the Canadian Dollar futures. The market is forming a massive 3-year H&S top pattern. The key price is 9568. A decisive close below this level would complete the pattern and establish a target of .8470.
6.20_CAD_weekly


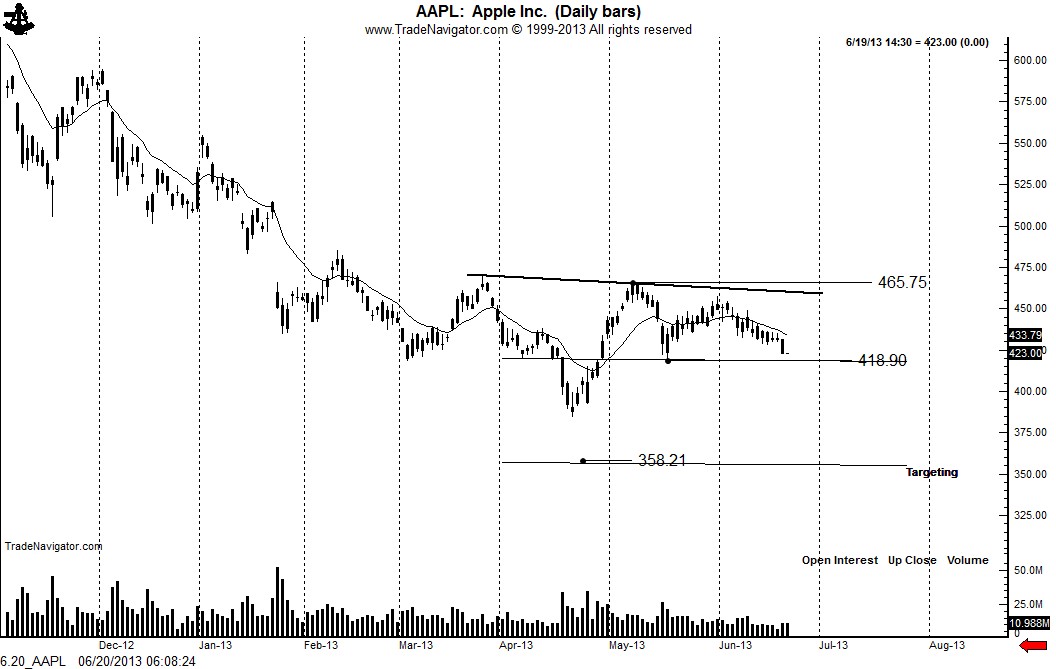
One final chart – $AAPL. A decisive close below 415 or so would complete a 4-month H&S failure pattern with a target of 358.
6.20_AAPL


Markets: $GC_F, $SI_F, $GLD, $SLV, $PL_F, $GE_F, $CL_F, $USDCAD, $AUDUSD, $HG_F


###