Tag Archive for: CFTC COT

Factor Special Report on Gold and COT data, December 2019

This content is for members only

Another look at COT data

This content is for members only
Copper COT

Can Copper Defy the Odds

Copper

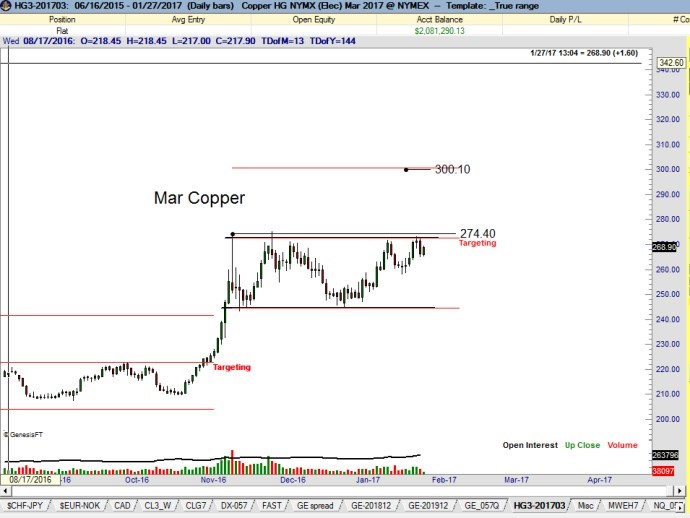
The daily and weekly charts of Copper appear to be forming an 11-week rectangle or ascending triangle, depending on how the boundary lines are drawn. A move and close above 274.40 would complete this consolidation pattern and establish an upside profit target of 300.


copper-3-peter-brandt-png copper-2-peter-brandt-png


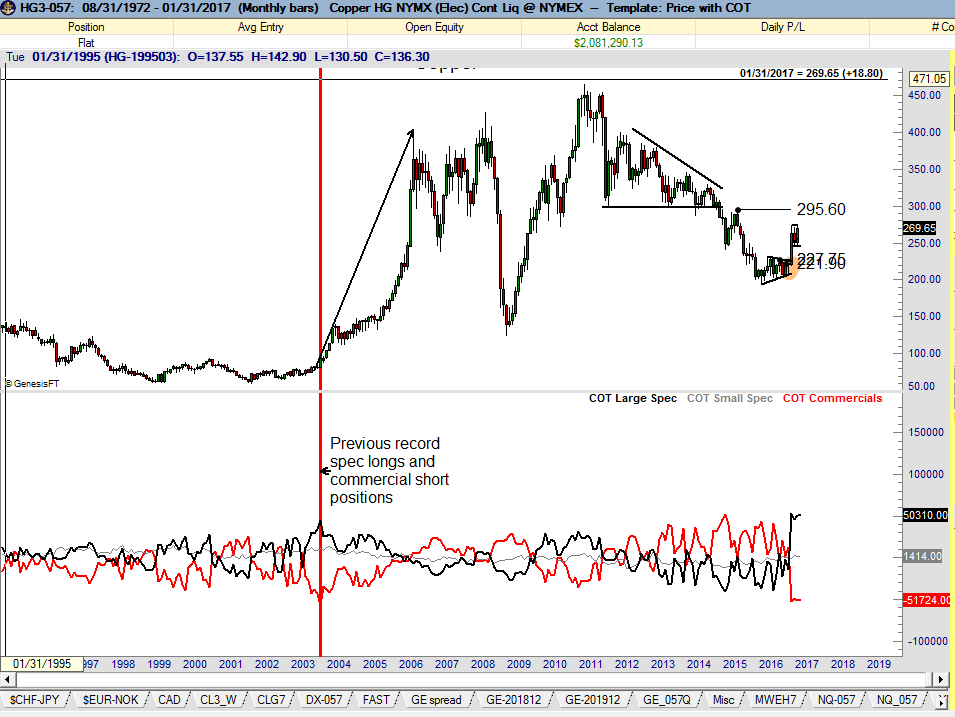
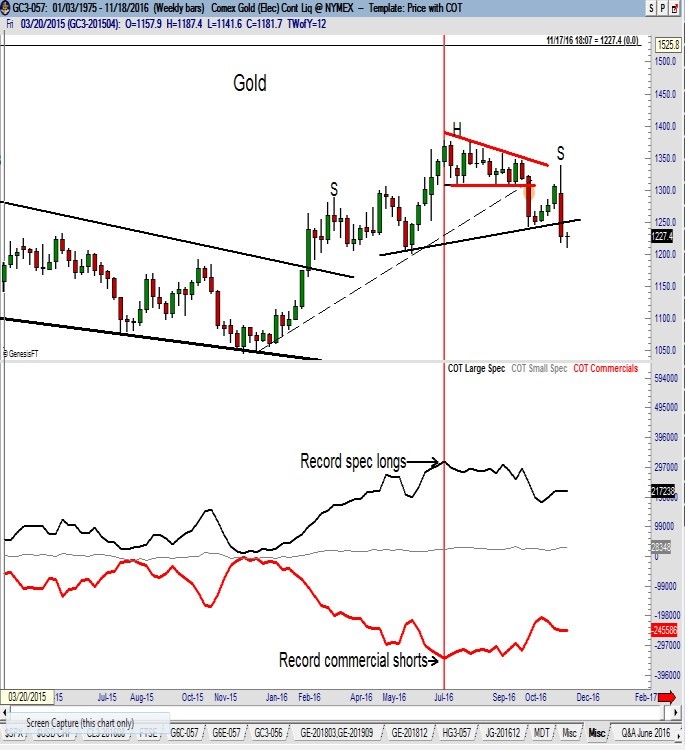
I am willing to buy the breakout in Copper, but with a huge caveat. The market is coming off a period of all-time record spec long and commercial short positions (by a massive margin compared to the previous records). Normally I would shy away from buying a market with this COT profile. Yet, as I have pointed out elsewhere in this Update, there have been rare occasions when a market is resolved in the direction of a record spec long COT profile. In fact, the most outstanding example of capitulation by commercial interests occurred in Copper in Oct 2003 – the period with the previous spec long and commercial short record holdings (see red vertical line on the monthly chart, next page). In that case the market went straight up for 2½ years with prices quadrupling. Usually commercial interests are right – but when they are wrong, they are dead wrong.


copper-4-peter-brandt

.

Factor Membership

.
Peter Brandt is a 40+ year veteran of trading.  Through his Factor Service, members receive:

checkTrading Commodity Futures with Classical Chart Patterns: A free PDF copy of Peter’s classic out-of-print book
checkWeekend Update: 10-16 pages full of in-depth chart analysis and charting commentary
checkAlerts: Detailed information on specific charts as unique opportunities present themselves
checkMarket Commentaries: Communications on specific topics regarding market speculation and trading distributed periodically
checkWebinars: Monthly member-only webinars where Peter speaks about current conditions and fields member questions
checkKnowledge Center: Fast and easy access to current and archived content from Peter’s extensive library of content
checkAutomatic notifications: Email and social media notifications are sent out when new content is published

.

View your Factor Member options here. You could consider your membership in the Factor Service as just one more trade. If the Factor Service is not of value to you, well, it is just one more trade that did not work.   Through the Factor Service I endeavor to alert novice and aspiring traders to the many pitfalls you will face – and to offer advice on overcoming those pitfalls. My goal is to shoot straight on what trading is all about.  For more information watch my 30 minute webinar where we cover the Factor service in depth.

I hope you will consider joining the Factor community.

Factor Trading - An Introduction

.

sig

.

.
###
.


 .

Perfect Soybean Oil

Soybean Oil futures

  This blog post is relation to the H&S Soybean Oil pattern identified within the post from September 12th https://www.peterlbrandt.com/soybean-oil-next/ The weekly Soybean Oil continuation graph has completed one of the most perfect textbook H&S bottom patterns I have seen in 41 years following futures markets.   Perfect Soybean Oil - Factor Trading - Peter Brandt Read More
CFTC COT Data - Factor Trading - Peter Brandt

CFTC COT Data – A discussion

CFTC COT Data – A discussion

As a trader, I have gone months and even years paying little attention to the composition of open interest as reported each week by the CFTC’s Commitment of Traders data (COT).  I have covered the topic of CFTC COT Data recently, only because a number of markets have experienced all-time record levels of spec long and commercial short positions. In a recent Factor update, I even raised the question of whether the old book on how to interpret COT data might be thrown away – that we might have entered a new and different era. Evidence now indicates that the old book and understanding of CFTC COT data still applies – that record levels of spec longs and commercial shorts is a reason for concern. The charts below show some recent and current markets exhibiting CFTC COT extremes. In the cases of Soybean Oil, Sugar, Gold, Silver, Cotton, Copper and Crude Oil, record COT spec long positions led to significant market sell offs. It should be noted that Soybean Oil, Sugar, Cotton, Coffee and Copper are still at COT extremes, indicating that additional selling pressure is likely. Please do not misunderstand me to be saying that record spec long positions MUST always lead to price declines. This is NOT the case. There have been times in the past when commercials have been forced to capitulate. For example, the monthly Copper chart (bottom chart featured) shows that a COT profile similar to the current profile resulted in an historic advance starting in Sep 2003.   CFTC COT Data - Factor Trading - Peter Brandt - Gold Read More

Factor Update – August 28, 2016

This content is for members only