https://www.peterlbrandt.com/wp-content/uploads/2018/09/Factor-Alert-September-18-2018-Fireworks-in-several-markets.jpg427640Peter Brandthttps://www.peterlbrandt.com/wp-content/uploads/2026/05/The20Factor20Report-2-scaled.pngPeter Brandt2018-09-18 15:09:012018-09-18 16:32:37Factor Alert, September 18, 2018 — Fireworks in several markets
https://www.peterlbrandt.com/wp-content/uploads/2017/10/Screen-Shot-2017-10-24-at-6.49.17-AM.png111344Peter Brandthttps://www.peterlbrandt.com/wp-content/uploads/2026/05/The20Factor20Report-2-scaled.pngPeter Brandt2018-02-19 17:45:242018-03-02 17:53:40The Economic Times February 19, 2018
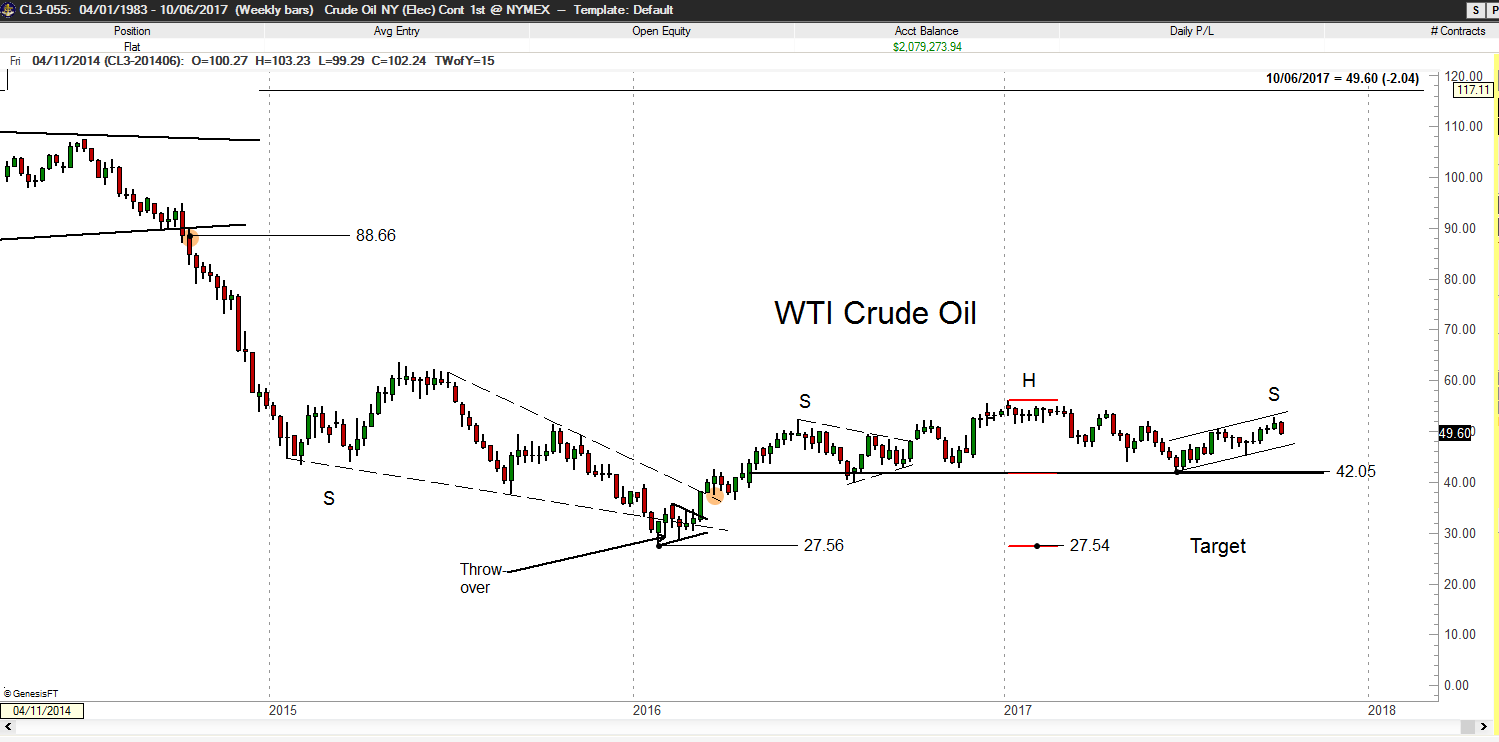
The weekly continuation chart of WTI Crude Oil displays an 18-month H&S top pattern. This is a chance that the Sep 28 high will represent the high of the right shoulder.
https://www.peterlbrandt.com/wp-content/uploads/2017/10/Crude-Oil.jpg7251233Peter Brandthttps://www.peterlbrandt.com/wp-content/uploads/2026/05/The20Factor20Report-2-scaled.pngPeter Brandt2017-10-10 12:18:522017-10-10 12:22:15The Next Big Crude Oil Move
https://www.peterlbrandt.com/wp-content/uploads/2017/09/Screen-Shot-2017-09-12-at-6.28.20-AM.png338336Peter Brandthttps://www.peterlbrandt.com/wp-content/uploads/2026/05/The20Factor20Report-2-scaled.pngPeter Brandt2017-09-05 07:37:432017-11-28 08:53:12JC Parets interviews Peter Brandt on The All Star Charts Podcast