
Thoughts on a Weekend Afternoon, September 6, 2021
This content is for members only


There are a few charts that really have my attention right now — although that does not necessarily mean I have a position or will enter a position in these markets. It does mean that I have a position or am looking at strategies to establish a position in these markets.
First, Crude Oil. I have commented several times in recent weeks via this blog or on Chart.ly on the recent consolidation zone. It now appears as though a descending triangle is being completed. Look for confirmation, but be aware that a bear trap could also occur. This is one of those patterns that could provide a head fake to the downside but provide big profits on the upside. But for now, I am short in my proprietary account with relatively tight stops.

Next, I will focus on one of the best potential chart set ups I have seen in a year or so — Natural Gas. The January 2012 contract displays a classic H&S bottom on both the daily and weekly charts. A major bottom is being constructed in this market. I am sure I will comment many times on this pattern and the trading implications in futures and ETFs. [Note: Dan Chesler, an excellent energy market analyst, brought this chart to my attention. Dan’s web site is www.chesler.us]


Next, Copper. I have been bearish on this chart for weeks, but the market is making it hard for position traders who sell weakness. Yet, the market is rolling over. What appeared to be a bear flag has now turned into an awkward 5-week continuation H&S pattern. If the trend has really turned down prices could easily drop $1 per pound in two months.

Next, Soybean Oil. I have had an upward bias in this market based on a possible continuation inverted H&S pattern. However, a sharp drop would complete a H&S failure sell signal. Also, the closing price chart (and I am paying more attention to closing price charts because of increased market “noise”) has completed a symmetrical triangle top. I am presently short Bean Oil, but I will remain flexible.


Next, July Chicago Wheat. If there ever was a H&S top pattern for the books, this is it. The problem is that H&S tops are supposed to occur after a large move up (i.e., tops are supposed to reverse a previous trend). This pattern does not qualify for this criteria in that the pattern itself WAS the move up. Nevertheless, this is a facinating chart worthy of following. I may or may not go short Wheat.

Next, July Silver. This market is in a major bear trend. The daily chart completed a H&S failure pattern on June 13 when the June 3 low was penetrated. I want to make a MAJOR point here, folks. I trade based on set-ups, knowing that 60% of my set-ups will fail over an extended period of time (over shorter time frames in the past, up to 80% of my signals have failed to produce profitable trades). I comment on set-ups, not on market opinions.
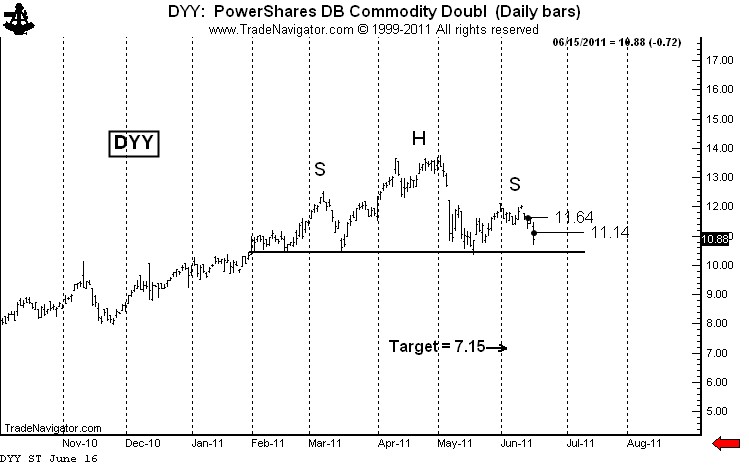
Finally, DYY (the ultra long commodity ETF). I am engaged in a short-selling campaign in this ETF. See previous posts here and here. I will pursue the strategy I have already disclosed. I am short two layers of DYY and will short a third layer if the H&S top is completed.

That’s all for now, folks.
Symbols related to this post: $ZW_F $DYY $NG_F $ZL_F $SI_F $SLV $CL_F $DJP $SIVR $GAZ $DBA $UNG
Disclaimer: I am a pure chartist. I do not trade based on fundamental or macro-economic factors.
###
Risk On – Numerous charts show signs of a pending decline
In the markets, as in real life, flags flying at half mast symbolize death. A number of half-mast flags and pennants in the raw material markets indicate that the steep decline in early May was just Act 1 in a two-act play. The flags are symbolic of the intermission between the Act 1 (the first decline) and Act 2 (the next phase of the bear trend).
Bear flags or pennants are present in the following markets:
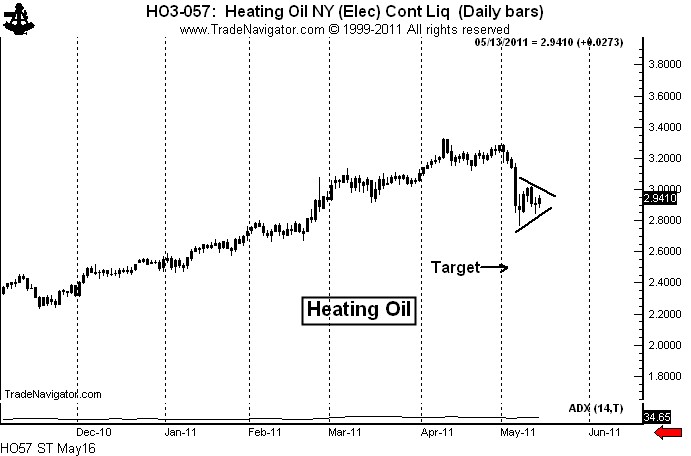
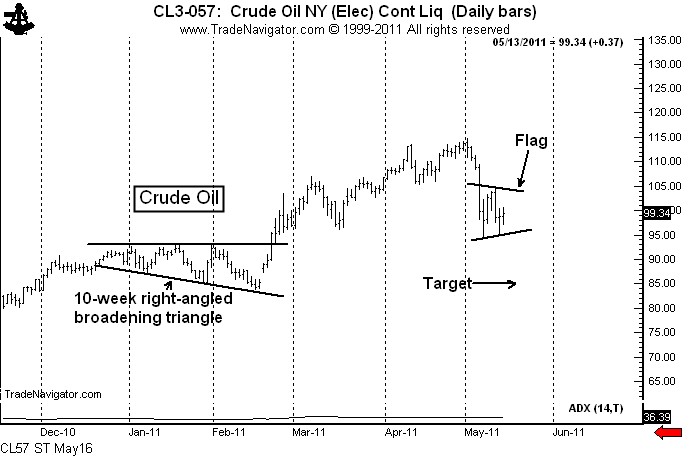
Crude Oil and Heating Oil display classic pennants. Rallies toward the May 11 high (while not necessary) would be an excellent shorting opportunity. The target of the pennant is Crude Oil is 84.80.
The target in Heating Oil is 2.5060.

The Gold displays chart construction similar to the energy products with two exceptions. First, there is potentially enormous support under the Gold market in the form of a previously completed 4-month continuation inverted H&S pattern. However, old support sometimes has a way of disappearing. Second, the huge volume on May 5 could indicate accumulation buying by strong hands. However, if the energy pennants lead to a strong decline it will be difficult for Gold to hold up in a Risk On/Risk Off market environment.

Sugar also displays a classic bear pennant. This market is in a well-established bear trend and has been since early February. Notice that the pennant in the October contract is forming just below the neckline of a 5-month H&S top. The target in October Sugar is 17.83.

If my analysis is correct in Soybean Oil, the current pause in the form of a flag should be the last support before a sustained markdown in price. Once this flag gives way, prices should trend to 45.60. (Caveat: The pattern in Bean Oil could prove to be an extremely bullish continuation H&S pattern. Traders need to be flexible on this one.)

Additionally, a number of other markets present technically bearish potential. These markets include:
The Russell 2000 is hovering right at the major 8+ month trendline. A violation of this trendline would indicate that the bull trend since March 2009 is seriously aging. The initial target would be 770 as part of the transition from bull market to bear market.

A confluence of technical developments can add to the legitimacy of a breakout. There are four factors that could trigger a sell signal in the S&Ps simultaneously by a decline below the May 6 low. First, the 2-month cup and handle bottom would fail; second, the 2-month trendline would be violated; third, the May 2 Ben Laden blow-off would be confirmed;

and, finally, the hourly chart symmetrical triangle would be completed.

I touched the third rail in late April when I announced that Silver was in the bubble phase. I was tarred and feathered on May 1 when I pronounced the previous week’s volume (7.5 years of global supply) was a strong sign that Silver had topped. The market has found support in the low 30s and a bounce into the low 40s is possible as Silver develops its own half-mast bear pattern.

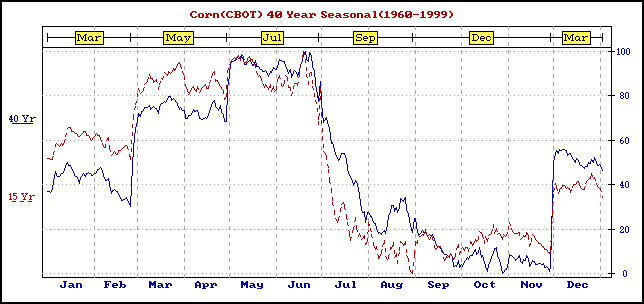
New crop December Corn has traced out a H&S top. It would not be unusual for Corn to top now.

The seasonal chart shown indicates a strong tendency for new crop Corn to top in May or June.

Finally, the daily chart of August Soybean Meal displays a very clear possible descending triangle. A close below the recent lows would complete this pattern and establish a target of 300.

Adding all things up, the period just ahead could be a tough life for raw materials (and stocks).
###
![]()

