Chart of the Day — Japanese stock indexes undergoing major upside breakout
This content is for members only

 When the timing is right, going long Japanese stocks and short T-Notes (prices) will be quite a ride
As a technical chart trader I look for price patterns that repeat themselves in different markets in different time periods. I also look for simiilar patterns in different (often unrelated) markets at the same time.
This later condition is exactly what we see during the last 15-1/2 years in the price action of the Nikkei 225 and U.S. 10-Year T-Note yields. The mirror image nature of the peaks and valleys in these markets is too similar to ignore, as seen below. I am sure those of you who are macro-economists can explain why these two markets are joined at the hip.

The above chart indicates that a bullish Japanese stock market play will work like a bearish U.S. T-Note play (short price, long yield) — that both sides of a long Japanese stock market and short T-Note price hedge could make money. The question is: Do the charts indicate the timing is right to probe this play? The answer is yes!
The chart below shows that the yield of the 10-Year T-Notes has been in a declining yield trend since the early 1980s. The chart displays a 24-year channel.

The 30-Year T-Bond yield chart (below) shows a possible 32-month ascending triangle. Keep in mind that a bear position on Bond prices is equal to a bull position on Bond yields. An advance by yields above 4.85% would decisively complete this triangle and establish a yield target of 6.8%. There is a chance that the June 2011 yield low of 4.17% is the final low of this chart configuration.

A chart of the CBOT Bond futures, $ZB_F, (reflecting Bond prices) is shown below. Note that this chart displays a possible right-angled broadening pattern. A close below 123-10 would complete this top.

In the meanwhile, the Nikkei 225 futures chart ($JNI_F) shows a line of strong support at 9300. If this level does not hold, then the March “earthquake-” event low could be tested.

Position traders have very well defined risk points for being short Bonds prices and long the Nikkei 225. This position can be established using futures (Board of Trade for Bonds and Osaka for the Nikkei) or with a number of ETF combinations. The ETF alternatives are

I prefer being short the ultra-long ETFs to being long the ultra-shorts because of the time decay factor of the ultra ETFs.
Markets: $ZB_F, $EWJ, $TMF, $TBF, $TLT, $TMV, $TBT
Disclaimer: I am a technical chartist and do not take into consideration fundamental or macro-economic factors.
###
Major Japanese stock indexes are on the edge of the cliff
The charts of the major stock indexes in Japan are on the edge of the cliff. The Topix, iShares MSCI Japan Index Fund and Nikkei Dow are at critical support levels. Traders with Japanese exposure should watch these support levels carefully. A penetration below these support lines would indicate that the “dead cat” bounce from the March lows is over.


Trading strategy
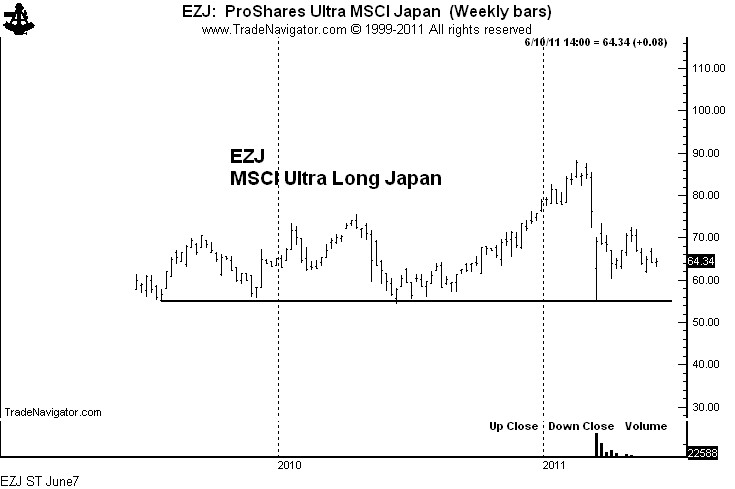
The trading strategy I like best is being short the Osaka Mini Nikkei or short EZJ, the Ultra Long ETF. The global stock indexes are famous for bull and and bear traps. The Japanese market, especially, often generates a false signal just prior to a big move in the the other direction. So, I will be very flexible with these markets. Should I short the Japanese market (the mini Osaka or the ultra long ETF), and should the market reverse back to the upside, I will double up going long.


![]()
