Tag Archive for: IAU

Factor Report charts on my radar screen for week of July 6, 2020

This document contains the charts on my radar screen for next week. Periodically I will add a market during the course of the week, but my going-in intent is that my trading will be restricted to the list I settle upon on Sunday afternoon.

Chart of the Day — What’s next for Silver


Bear market in Silver may be entering its next (and final) down phase

Critics of price charting charge that charts only show for certain where a market has been. I completely agree.  These charges are valid. Yet, understanding where market has been can provide historical context — and this historical context can be useful in anticipating the future.

With the above disclaimer in mind, let’s take a look at Silver’s chart history.

Firstly, the monthly price chart shows that Silver remains in a long-term bull trend from the 1932 low. Yet, long-term trends experience sudden and violent counter-trend reactions. Such was the case in the 1980 through 1993 decline during which Silver priced declined by 93%.  Silver bulls should know they can go broke being right on the metal’s long-term direction.

4.15_Silver_M_100yrs

The Silver market is currently undergoing another significant price correction, as shown on the weekly chart. This decline can be broken down into several classical chart configurations or phases.

Phase A was the blow-off exhaustion top experienced in April 2011. This blog correctly identified this as an important market top. See here (How do you spell bubble … SILVER, Apr. 24, 20111) and here (8 years of Silver supply changed hands last week, May 1, 2011). The blow off was immediately followed by a 35% price decline — with Silver bulls declaring a conspiracy.

Phase B was a retest of the top, taking the form of a bear wedge.

Phase C, lasting from October 2011 through April 2013, represented a rectangle. Phase D was a textbook horn or sloping top in the final stages of Phase C. It was during this horn, on February 20, 2013 that this blog carried a post titled “What’s happening to the metals – a chart update.” This post predicted a sharp decline in precious metals, specifically identifying a target of $1250 for Gold, the priced at $1570. The completion of the continuation rectangle in April 2013 set a still-unmet target of 1660. Remember, targets are not sacred. Also keep in mind that while I have made some insightful calls over the years, I also have many market pronouncements leading to a over-sized serving of humble pie.

Phase E has been the unfolding congestion since the June 2013 low. This congestion appears to be taking the form of a descending triangle with support in the 1800 to 1850 zone. Should this support give way, then the 1660 target would be quickly met, with a further target down to 1350.

4.15_SI_W

Caveat: Under rare circumstances a descending triangle might be resolved by an upside pattern completion. As such, a close by Silver above 2250 would negate the descending triangle labeling.

$SI_F, $SLV, $SIVR, $GLD, $IAU

 Note: This type of analysis is normally distributed only to members of the Factor subscription service (see navigation bar above).

I think I know what the Gold market is doing


Gold may be showing its hand — and the hand could be a real winner for the bulls

On November 20 I posted a chart history of the Gold market. Click here to see this special 43-page report.

Two points I made in the report were:

  1. Gold is purest technical market in the world
  2. Significant trends in Gold are nearly always announced in advance based on the chart structure -Gold nearly always shows its hand in advance for those who are watchful and unbiased

Well, Gold may be showing its hand.

The monthly closing price chart below speaks for itself. Gold has been in a powerful bull trend since the 2001 low and no clear top has been formed. Absent a clear chart top, the default assumption must be that the period since the August 2011 high will serve as a continuation pattern. However, a decisive close below the 2012 low would be an indication of a top in Gold.

 1.9_GC57_monthly_close

The weekly chart shows that Gold has formed a very clear 15-month rectangle pattern. This pattern is the key to the long-term trend in Gold — whether the up trend will remain dominant or a new downtrend would emerge. In the meanwhile, Gold must be considered as trendless on a weekly basis.

 1.9_GC57_weekly

Here is where it gets interesting. Often times in the late stages of a prolonged weekly chart congestion a daily formation will develop to serve as the launching pad for the completion of the weekly chart configuration.

The daily chart in Gold displays a possible 3-month channel. A breakout of this channel could provide the springboard for the completion of the weekly rectangle.

 1.9_GC57_daily

Readers should keep in mind that I deal with possibilities, not probabilities. Most chart patterns fail, leading to a continued morphing of a congestion area. This current daily chart channel would fail to materialize and Gold could drift sideways for many, many more months. However, the possibility exists that this channel would the the last act of this sideways congestion prior to a major price advance.

Markets: $GC_F, $GLD, $IAU


###

Trading futures- and forex-related ETFs is for fools

It is idiotic to trade an ETF/ETN when the underlying futures contract can be traded

If you cannot see the attached PDF, click here.

[scribd id=115345564 key=key-wftypqzvufr2me01ry4 mode=scroll]


#ETFs, $GLD, $SLV, $UNG, $SPY, $JJC, $OIL, $IAU, $FXE, $UND


###

The History of Gold Charts


Gold — the ultimate charting market


If you are unable to view the embedded pdf, click link here.

[scribd id=113820362 key=key-1iuxk1b8pcno02tgkynu mode=scroll]


$GC_F, $GLD, $IAU


Gold Bulls & Silver Fools Lose $29 Billion in September

He’s back!

It was not my intent to be tip-toeing in the blogoshpere this soon. I really thought my next blog post would be introducing the “grand” old lady of song. But the story of this post is just too big to pass up. Besides, you honored me by voting this among your top blogs on Barry Ritholtz’ web site, TheBigPicture, (see here) so I needed to throw you a meaty bone.

Well, this one is really meaty. Get ready to enjoy. The story behind this post will be in the history books.

You read the headline correctly, during the month of September Gold bulls and Silver fools lost a grand total of $29 billion — for those of you who cannot spell, that is $29,000,000,000!

The table below tells the story.

Source of table: Factor LLC Research

That’s a lot of money when one is not talking about some “no-earnings, no-income, just another average idea” internet start-up.

But the story does not end there. There are three other story lines.

Story line #1 — the money is gone and is not coming back.

This story line will be told by following the open interest in the futures market. The exchanges are always a few days late on this figure, but chances are great that open interest in Gold and Silver will take a big dive this week. Much of this decrease will be due to a grand puke out.  This carnage will come from forced liquidation. Of course, the Silver fools will play the victim card once again (what’s new), blaming the exchanges for raising the margin requirement.

This forced liquidation we will see is I what talked about in a blog post on Silver in early May titled, “When the cops raid the whore house, everyone is arrested, including the piano player.” Click here and here.

If open interest does not drop substantially this week, then look out below. Liquidation will come now or it will be more painful later. The whore house is being raided, make no doubt about it.

Story line #2 — $29 billion is nothing compared to the drop in the value of above ground stocks.

Do the math. There are 166,000 tonnes of Gold sitting as above ground reserves. If I am doing my math right, that is at least 5.3 billion ounces.  If I am not doing my math right I am sure to hear about from a precious metals bull. A $200 drop in Gold’s price is, what, a meager $1.06 TRILLION. Not exacly chump change! You could buy an internet start up for this amount of money. In fact, you could even buy$AAPL.

What about Silver? Total supplies from all sources in 2011 is approximately 1.058 billion ounces (based on 2010 figures from Silver Institute). Silver topped at around $49 in May. A $18 drop in fool’s gold equals $19 billion.

Story line #3 — the drop is far from over.

The precious metal markets have entered major bear market corrections (at least for Gold — Silver is dead meat). The charts below tell the story. Gold has completed a double top, indicating a decline to at least $1,400 (heck, we’ve almost been there), with a further possibility of $1,100. The shorting zone is $1,700 to $1,750. If I was a Gold bull (in fact, I am a Gold bull in the very long term, but that does not mean I have to sleep with Gold under my pillow every night), I would be hoping that the 3-year trendline holds. If not, $1,100 here we come!

I know you all think I pick on Silver bulls. I do so for a very specific reason. No other market has a herd of bulls who so arrogantly refuse to hear any other story than their well worn rut and who become victims of everything but themselves when they are wrong. It is this trait I take aim at, not the fact Silver itself is involved. I know these statements are true from the howl of the wolves I received after posting the following pieces back in April and May.

Seriously, you would have thought I shot someone’s grandmother for even speaking out against the sacred metal. Any way, I am getting off track. The daily Silver graph has completed a massive failure top. There are many downside targets in Silver, starting at $20 and extending down to $14 (remember … “Strong Opinions, Weakly Held,” another post howled at by the soprano choir boys). Silver kissed the breakout point today, but Silver would just be winking at you if it happens to rally above $33.

Well, that’s it for now folks. It has taken me 120 minutes to do this post — now I remember why I don’t want to post every day. Oh, the terrible memories.

By the way, I am still bearish on stocks. The charts have been morphing for eight weeks and will eventually make themselves clear to us for the next slam event. The fact the charts have been morphing made me reluctant to follow last week’s break. But know this, the grand old dame continues to warm up backstage. Because it is not all over until she sings.

Markets: $GLD, $GC_G, $IAU, $SLV, $SI_F, $SPY

P.S. Sorry, I will not be replying to any replies on this post. But feel free to take shots at each other.

###


Want to know what Gold is going to do — the key is the August 8 gap

Exhuastion gap, measuring gap, area gap or breakaway gap — that is the question.

A significant up gap occurred in Gold on August 8, when the low of the day was higher than the previous day’s high by about $8 per oz. The fact this gap took place on Monday adds to its significance. Do not dismiss this gap lightly. In it you will find the key to the intermediate future of Gold prices.

This is the first gap in Gold since August 1, 2007. There were a few gaps in 2007 (not shown) — they were all filled quickly and became “area gaps” as part of Gold’s preparation for the run from under $700 to the 2008 high at $1033. 

Allow me to analyze the gap through a process of elimination.

The gap is not a breakaway gap. Breakaway gaps occur out of a prolonged period of congestion. Gold has been in a steep advance.

If it is a measuring gap (or half-way gap), the question is half way from what? It could be a measuring gap — and if so, the measurement is taken from the July 1 low at 1481. (See chart below.) This gap would then project a Gold price of 1872 to be attained rather quickly. Right now the market is acting as if the August 8 gap was of the measuring variety.

If the Gold market stalls and the gap is closed within the next week or so, then the gap would be either an area gap or an exhustion gap. In either case it would be wise for one to abandon a bullish stance.

An area gap would indicate that Gold will under go a lengthy period of consolidation in a wide trading range. The trading range could produce a reversal or continuation pattern, but there would be no urgency to hold a position.

An exhustion gap would indicate that the entire bull move in Gold is over for the intermediate term. Prices would likely retreat to at least the high 1400s, and then possibly go lower.

Should prices retreat back to the low 1680s and then gap down through the same price level as represented by the up gap on August 8, the chart would contain an area island top. If this down gap would not be closed quickly it would indicate that the bull market in Gold is over for the next few years. The chart below shows the island top in Gold from 1980. Gold prices eventually retreated to $297.

Tactically, traders can hold longs until the gap is filled. If the gap is filled, then I would want to dump my longs on rallies.

Markets: $GLD, $PHYS, $IAU, $GC_F

Gold priced in Swiss Francs ready for big move

Gold/CHF ratio coiling for 230 CHF move

The conventional wisdom is…”As Gold goes, so goes the Swiss Franc.” In reality, Gold expressed in Swiss Francs has experienced a major bull move in recent years.

The weekly chart of the Gold/CHF ratio has been coiling since June 2010. Gold has actually lost to the $CHF in the past 13 months.

The daily graph displays this coil more clearly. Coils, also called symmetrical triangles, can be resolved in either direction. An advance out of the top of this coil would result in a strong advance by Gold against the Swissie. A decline out of the bottom would result in a drop to at least the dominant trendline at around 1090 CHF with a further move to 1015 likely. In either case, this is a big enough move to treat as an individual trade.

This coil is about 230 CHF wide at its widest point (between the first major high and the first major reaction low). Thus, the resolution of this coil should result in a 230 CHF move. My preference is to play this trade using futures contracts. Stock traders could use the ETFs, $GLD and $FXF. In either case, equal USD values should be established in both legs.

 Markets: $GLD, $GC_F, $IAU, $USDCHF, $6S_F, $FXF, $$

###


Gold — next stop is $1,735

Swing targeting sets next objective at $1,735

The principles of classical charting, in simple terms, are that:

  1. Market prices — when plotted on a graph — tend to form recognizable geometric configurations.
  2. The exact nature of a geometric pattern carries with it the implications of the direction and magnitude of a subsequent thrust within a price trend.

On the basis of the above, the next stop for Gold should be $1,735. Consider the following.

The price advance from the July 1 low at 1478.3 (noted as “A”) to the July 19 high at 1610.7 (B) carried a distance of 132.4.  Following the July 19 high, the market developed a 12-day flag. Flags normally slant against the preceding trend. That this flag slanted in the direction of the preceding trend was a sign of significant underlying market strength.

A general rule of classical charting is that flags mark half-way points (thus, a flag can be referred to as a “half-mast” flag). Thus, the rally from the July 28 low (the last minor low of the flag) should equal the distance from A to B. Projecting the A to B move of 132.4 upward from 1603,8 yields a target of 1735.

This current rally should carry to 1735. Any dip should find support at the upper boundary of the flag. For now, given what we know, whenever prices dip the Gold market is winking at you. A close below the August 2 low is required to negate this intepretation.

Markets: $GC_F, $GLD, $$, $SLV, $PHYS, $IAU

Disclaimer: I am long Gold from July 12, July 28 and August 2.

###

Charts I am looking at for the week of July 18, 2011

Due to a death in the family, this may be my only post of the week.

Following are the charts that have my interest coming into a new week.

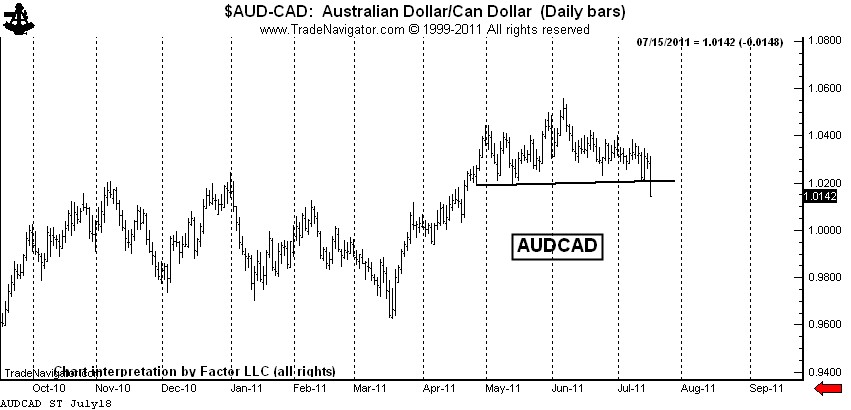
$AUDCAD — This forex pair completed a rounding top last week. I am short, but not as short as I would like to be. I will have orders in place to extend my leverage if the market can retest the top.

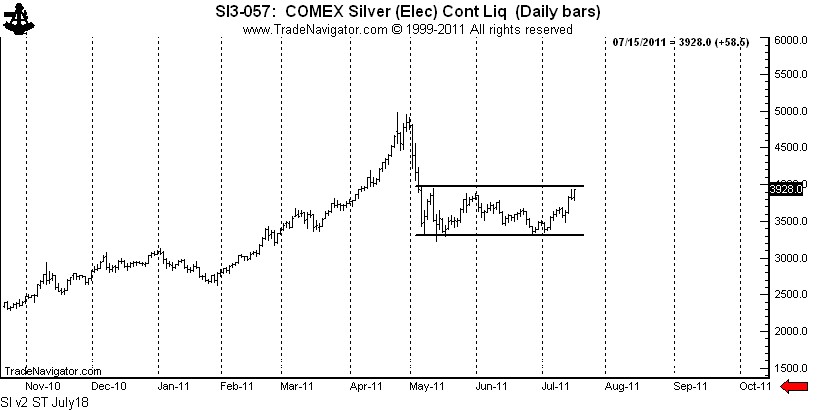
Silver: $SI_F, $SLV — The rally late last week completed a possible symmetrical triangle bottom. The bulls appear to be back in control in Silver. I do not have a position in Silver futures, but am long $SLV with a stop below last Wednesday’s low. 

Was my forecast for $20 Silver wrong? Right now that is the way it seems. Trading is a marathon, not a sprint. I have some very bad news for all the Silver bulls who are such fond fans of my blog — I was NOT short last week. Sad, but true! I will let you know when I go short. By the way, I always trade with a stop and seldom risk more than 100 basis points per trading event (one percent of capital).  
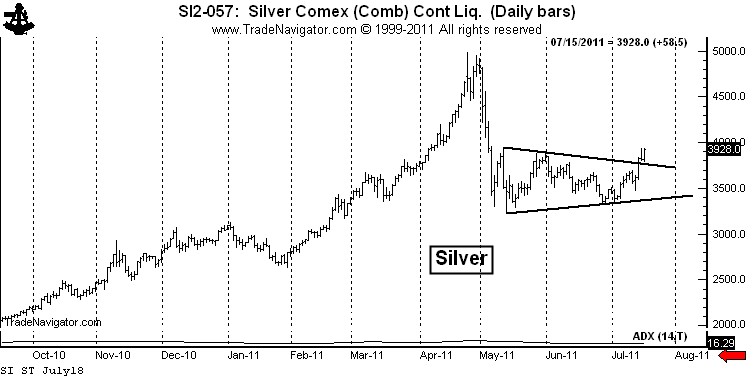
There is another intrepretation of the Silver chart that is not as immediately bullish. I have a great dislike for chart patterns with diagonal boundaries. The symmetrical triangle is my worst enemy. I much prefer a horizontal chart boundary. Silver has not yet completed a bottom if we use horizontal boundaries to define the trading range over the past 10-weeks, as seen below.

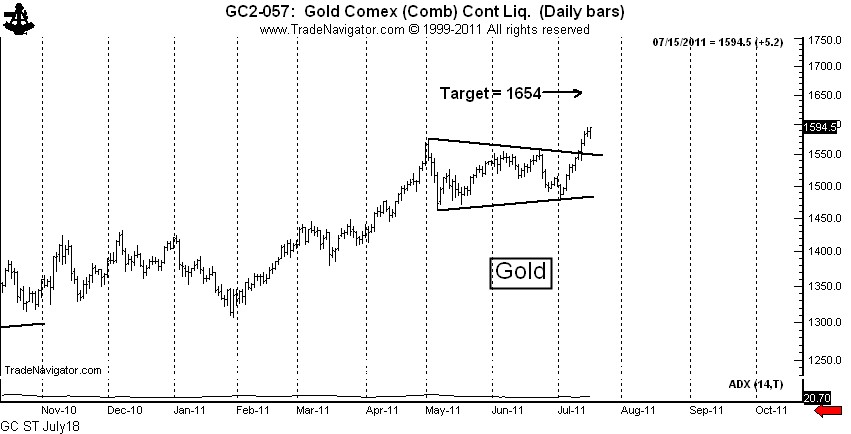
Gold: $GC_F, $GLD — The Gold market completed a text-book continuation symmetrical triangle this past week. I am long Gold futures and Gold ETFs. Gold, unlike Silver, may one day be monetized.

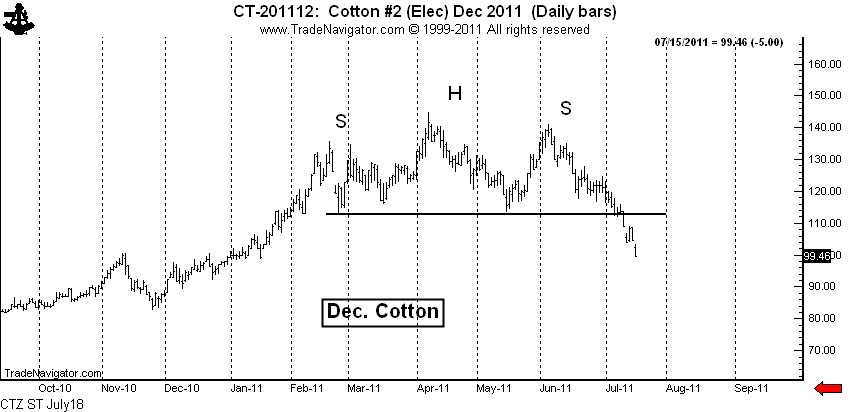
Cotton: $CT_F — I feel like an idiot. I shorted Cotton really well based on the H&S top. I felt like a genius when I covered on Friday, only to have the market go limit down. I really thought the market would cover the opening gap. I got cute — and I doubt the market will let me back in. Big profits are important. I let one get away in Cotton. I should have been adding, not covering.
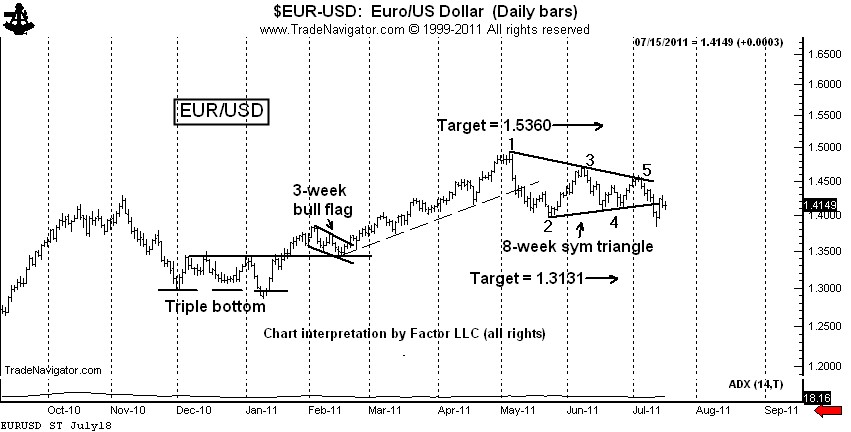
$EURUSD, $G6E_F, $UUP, $FXE — The decline on Wednesday completed a classic 6-point symmetrical triangle top. This completed triangle has been violated intraday, but not on a closing basis. I am short, using Thurday’s high as protection. I really thought I tagged a good one on Wednesday. The forex markets are vicious.

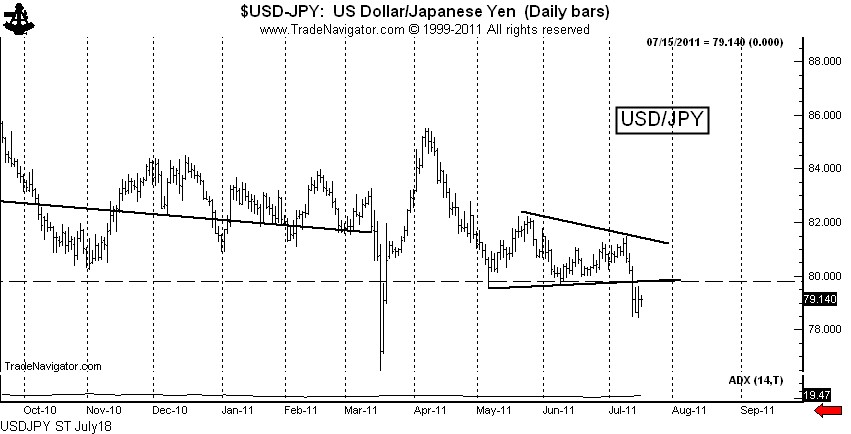
$USDJPY, $G6J_F, $FXY — The decline last week completed a triangle, but that is not the real story. Friday’s close is the lowest week-ending close in history, breaching the 1995 low (not shown). We may see Bank of Japan intervene next week, or it may be that the BofJ is capitulating until a lower price level is reached (such as 75.00). I am short $USDJPY and fully expect to have the BofJ run me out of the trade.

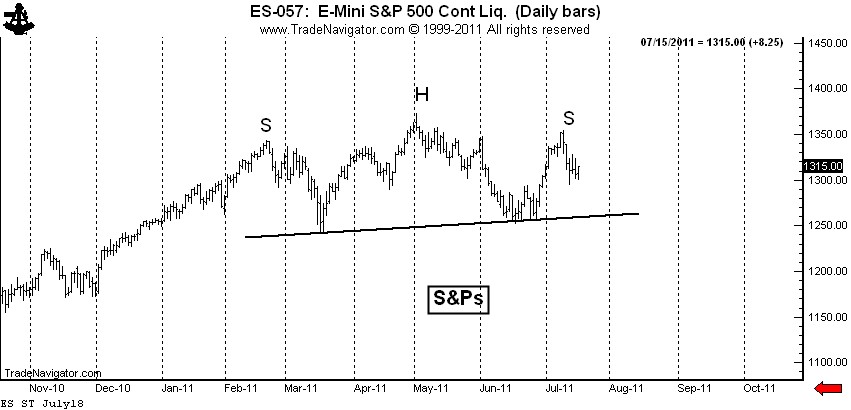
S&P 500: $SP_F, $ES_F, $SPY — This is my “pie-in-the-sky” chart. The daily graph displays a possible H&S top. If this analysis is correct (big IF), the right shoulder high is in place. This chart needs to be on everyone’s watch list. I am flat, tempted to go short under last week’s low. The CFTC Committment of Traders data released late last week was bearish.

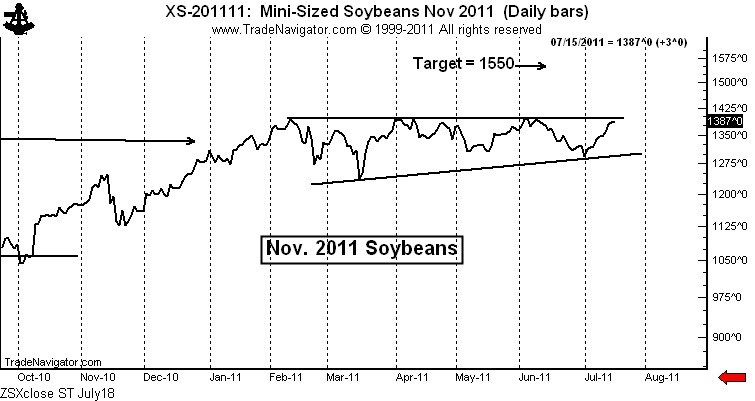
Soybeans: $ZS_F — This is an extremely intriguing chart. I fully expect that this chart pattern will be completed by an upside breakout — whether the breakout has follow through is a different story. I am lightly long Soybean futures with a stop below the July 12 low. I will add if the market breaks out intraday. I will add more if the market breaks out on a closing basis.

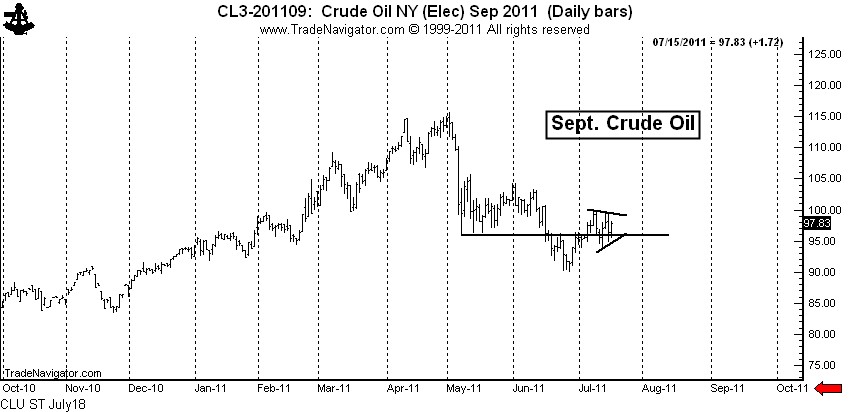
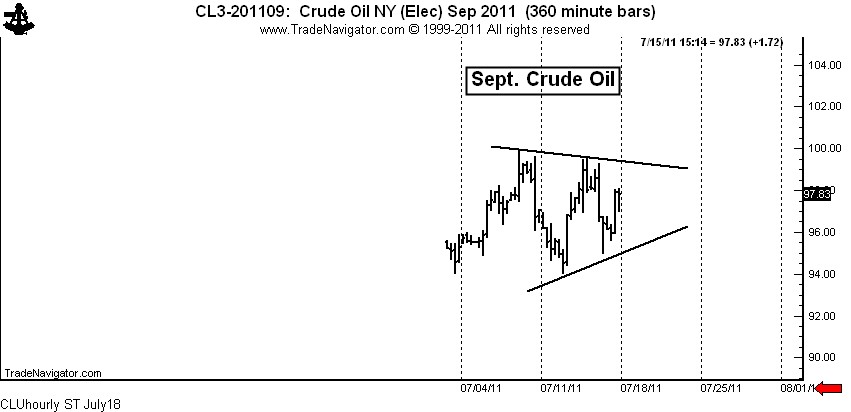
All the above charts are fairly long-term in duration. As a token to you shorter-term chartists, I leave you with Crude Oil. I am not in this market and probably will not become involved due to travel, but an interesting story can be told for getting long.

Crude Oil: $CL_F, $USO — If Crude Oil was in a “for-real” bear trend, then the May low should have turned back any and all rallies. Yet, the market has now climbed back above the May low. This is a sign that the May to June decline was a correction, not the start of a new bear trend.

On a shorter-term basis, the market is forming a 7+ day symmetrical triangle. A completion of this small pattern would probably lead to a test of the June 1 high at 104+. See the hourly chart below.

Let me throw in a couple of final charts. For the first time in a very long time I have some encouraging words for the millions of you who think Natural Gas prices are too cheap.

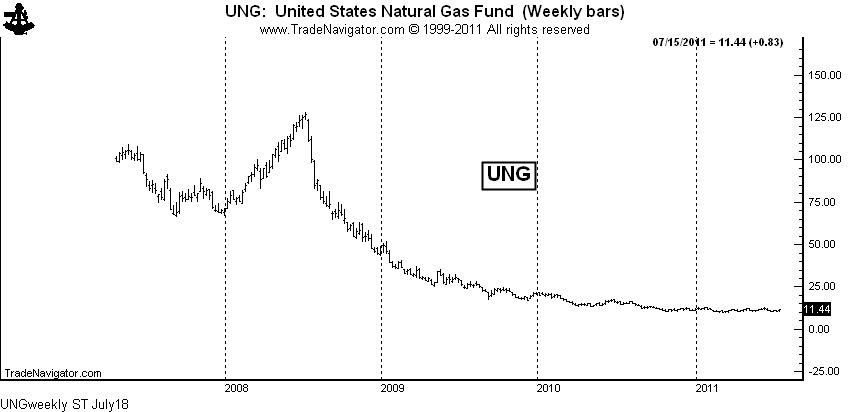
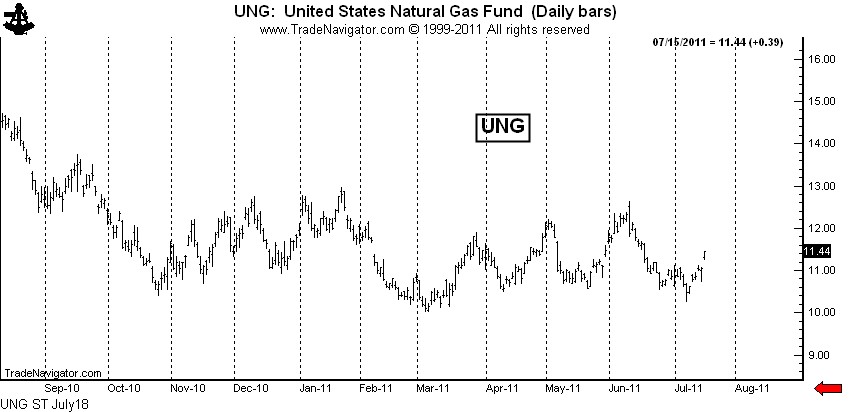
Natural Gas: $NG_F, $UNG, $UNL, $GAZ — Being long Nat. Gas ETFs has been a losing game due to the huge carrying charges that disappear each month. The weekly chart of UNG shows the result of this time decay.

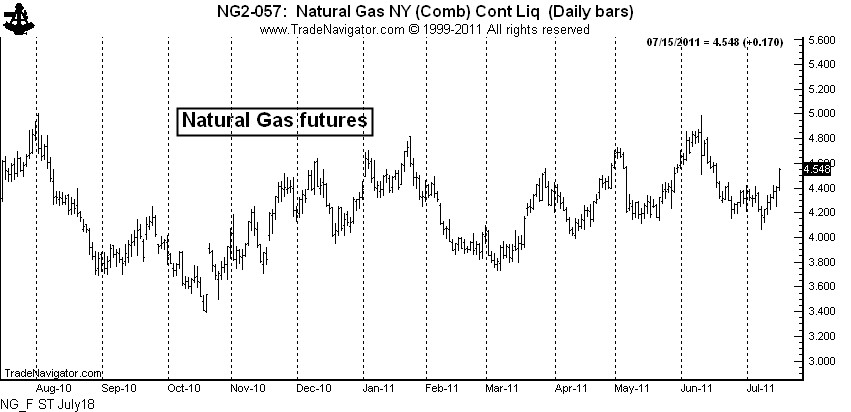
This time decay may continue to take place, but I can say with as much certainty as possible that the physical market has bottomed.  The chart of Natural Gas futures shows that the market has lifted well off the 2010 low and is forming high lows and higher highs.

There is also some signs that UNG has bottomed — the March low may hold, despite the massive supply on hand and the negative publicity on fracking.

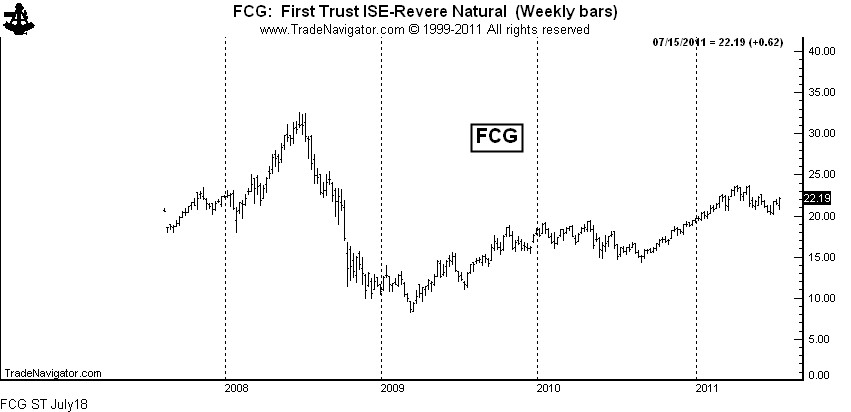
While there may come a time to be long the ETFs for the physical commodity, I would prefer to own the ETF for the producers and other companies deriving income from the production and processing of the product. A chart of FCG ends this post.


Markets: $AUDCAD, $SI_F, $SLV, $GC_F, $GLD, $IAU, $CT_F, $EURUSD, $FXE, $UUP, $ZS_F, $SP_F, $SPY, $CL_F, $USO, $USDJPY, $G6J_F, $UNG, $UNL, $GAZ, $FCG

###