Tag Archive for: IWM

US Stocks - Peter brandt - Factor

U.S Stocks Look Promising
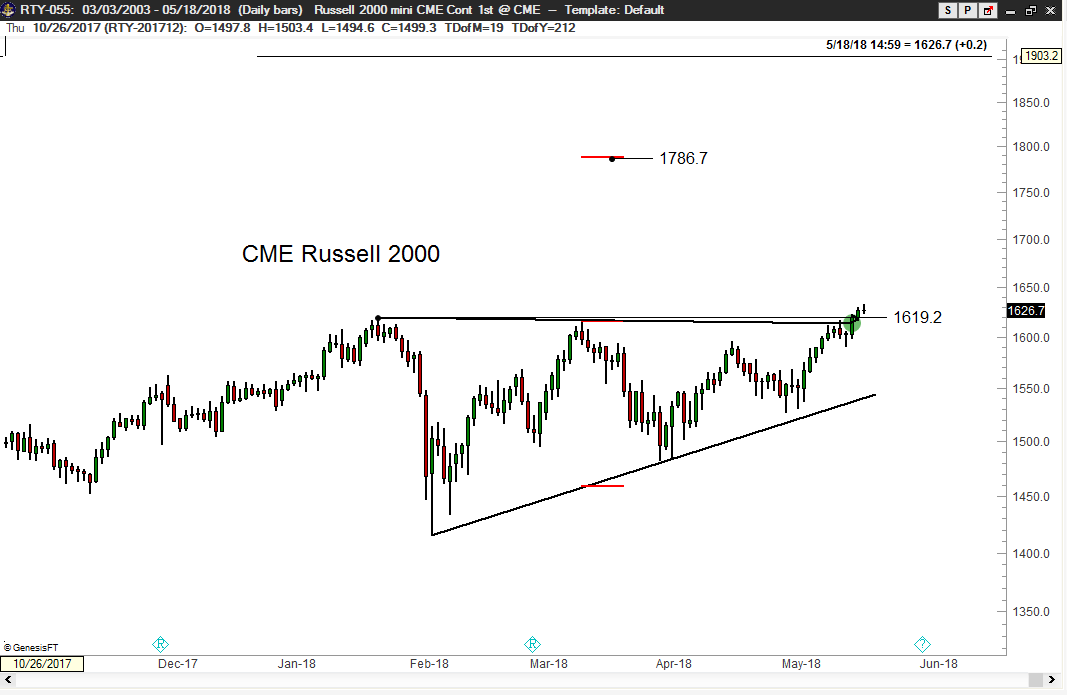
 

Russell 2000

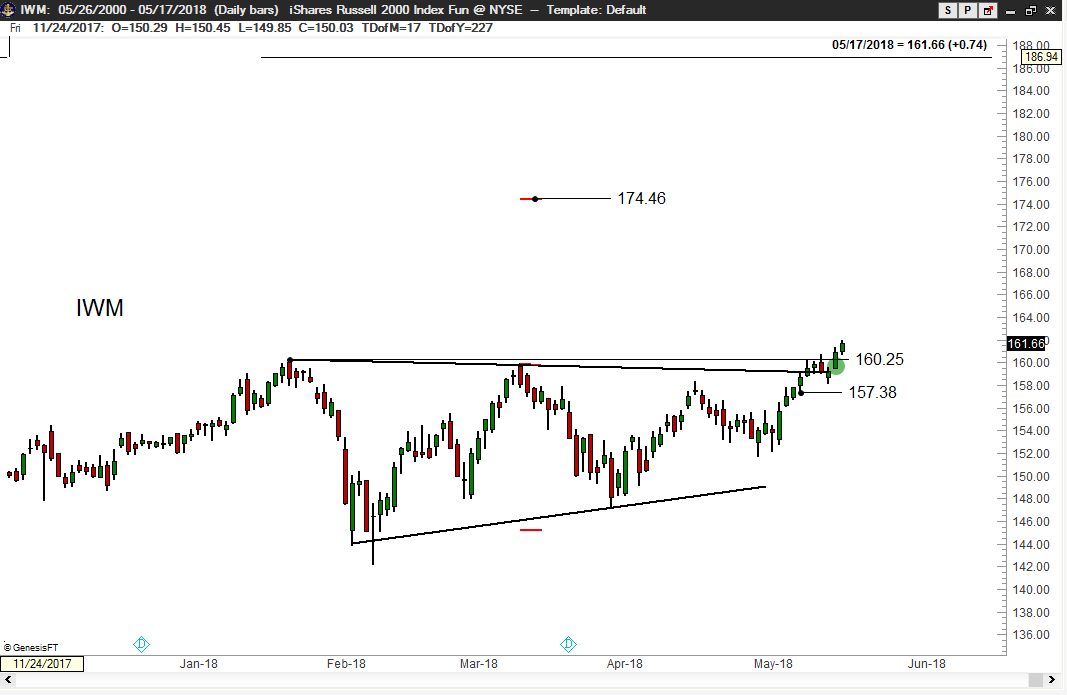
U.S Stocks look promising, with the Russell 2000 appears to be leading the upward parade. The Factor is long this market as of last Wednesday. The daily chart of the Russell 2000 ETF (IWM) is shown below after a breakout this past week that was promising.
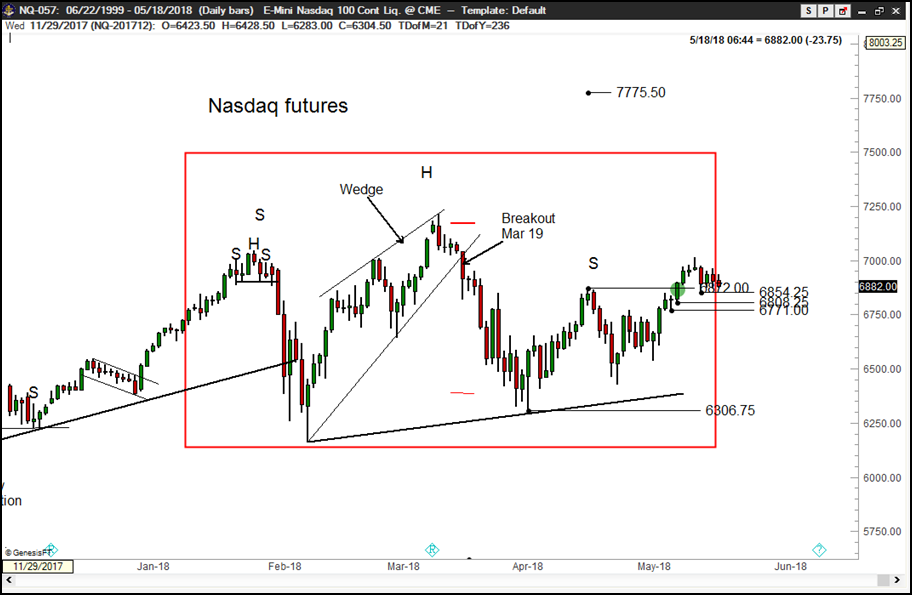
 

US Stocks Peter Brandt – Factor - Russell 2000


US Stocks Peter Brandt - Factor IWM


NASDAQ

A 4+ month H&S failure pattern has been completed. The upside target – if the interpretation is correct – is 7775. Factor is long the ETF (QQQ) using this past week’s low for protection.
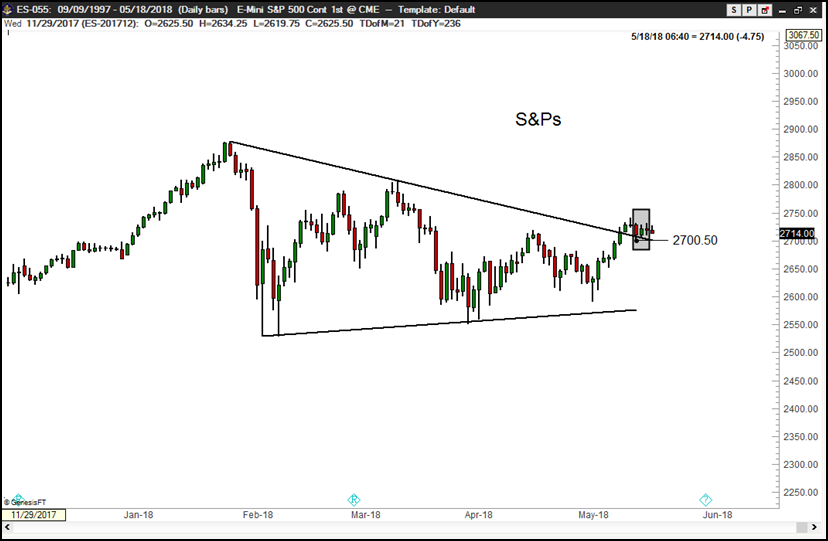
 

US Stocks Peter Brandt – Factor - QQQ


S&Ps

The daily chart of S&P futures displays a giant 16-week symmetrical triangle. The S&P chart is much weaker than the charts of the Russell or NASDAQ. For this reason the S&Ps represent the best candidate for a short trade. The price bars on Tuesday, Wednesday and

Thursday formed a potential bearish Hikkake pattern.

[See https://en.wikipedia.org/wiki/Hikkake_pattern. Long-time friend and Factor member Dan Chesler is recognized as the father of the Hikkake pattern.] I will pay close attention to the S&Ps early next week. I will consider a short trade if a measured risk point can be identified.


US Stocks Peter Brandt – Factor - SP500


Factor Membership

.

Peter Brandt is a 40+ year veteran of trading. Through his Factor Service, members receive:

checkTrading Commodity Futures with Classical Chart Patterns: A free PDF copy of Peter’s classic out-of-print book
checkWeekend Update: 10-16 pages full of in-depth chart analysis and charting commentary
checkAlerts: Detailed information on specific charts as unique opportunities present themselves
checkMarket Commentaries: Communications on specific topics regarding market speculation and trading distributed periodically
checkWebinars: Monthly member-only webinars where Peter speaks about current conditions and fields member questions
checkKnowledge Center: Fast and easy access to current and archived content from Peter’s extensive library of content
checkAutomatic notifications: Email and social media notifications are sent out when new content is published

.

View your Factor Member options here. You could consider your membership in the Factor Service as just one more trade. If the Factor Service is not of value to you, well, it is just one more trade that did not work. Through the Factor Service I endeavor to alert novice and aspiring traders to the many pitfalls you will face – and to offer advice on overcoming those pitfalls. My goal is to shoot straight on what trading is all about. For more information watch my 30 minute webinar where we cover the Factor service in depth.

I hope you will consider joining the Factor community.

Factor Trading - An Introduction

.

sig

.

###

Factor Update, May 18, 2018

This content is for members only

Factor Update, May 13, 2018

This content is for members only

Factor Alert, May 10, 2018 — U.S. equities market

This content is for members only

Factor Update, May 6, 2018

This content is for members only

Factor Update, June 25, 2017

This content is for members only

Factor Alert, June 9, 2017 — A couple of set ups in the U.S. equity market

This content is for members only

Flags flying at half-mast – a sign of death!

 Risk On – Numerous charts show signs of a pending decline 

In the markets, as in real life, flags flying at half mast symbolize death. A number of half-mast flags and pennants in the raw material markets indicate that the steep decline in early May was just Act 1 in a two-act play. The flags are symbolic of the intermission between the Act 1 (the first decline) and Act 2 (the next phase of the bear trend). 

Bear flags or pennants are present in the following markets

  • Crude Oil
  • Heating Oil
  • Gold
  • Sugar
  • Soybean Oil 

Crude Oil and Heating Oil display classic pennants. Rallies toward the May 11 high (while not necessary) would be an excellent shorting opportunity. The target of the pennant is Crude Oil is 84.80.  

The target in Heating Oil is 2.5060.

The Gold displays chart construction similar to the energy products with two exceptions. First, there is potentially enormous support under the Gold market in the form of a previously completed 4-month continuation inverted H&S pattern. However, old support sometimes has a way of disappearing. Second, the huge volume on May 5 could indicate accumulation buying by strong hands. However, if the energy pennants lead to a strong decline it will be difficult for Gold to hold up in a Risk On/Risk Off market environment. 

Sugar also displays a classic bear pennant. This market is in a well-established bear trend and has been since early February. Notice that the pennant in the October contract is forming just below the neckline of a 5-month H&S top. The target in October Sugar is 17.83. 

If my analysis is correct in Soybean Oil, the current pause in the form of a flag should be the last support before a sustained markdown in price. Once this flag gives way, prices should trend to 45.60. (Caveat: The pattern in Bean Oil could prove to be an extremely bullish continuation H&S pattern. Traders need to be flexible on this one.) 

Additionally, a number of other markets present technically bearish potential. These markets include:

  • Russell 2000
  • S&P 500
  • Silver
  • Corn
  • Soybean Meal

The Russell 2000 is hovering right at the major 8+ month trendline. A violation of this trendline would indicate that the bull trend since March 2009 is seriously aging. The initial target would be 770 as part of the transition from bull market to bear market. 


A confluence of technical developments can add to the legitimacy of a breakout. There are four factors that could trigger a sell signal in the S&Ps simultaneously by a decline below the May 6 low. First, the 2-month cup and handle bottom would fail; second, the 2-month trendline would be violated; third, the May 2 Ben Laden blow-off would be confirmed;

and, finally, the hourly chart symmetrical triangle would be completed. 

I touched the third rail in late April when I announced that Silver was in the bubble phase. I was tarred and feathered on May 1 when I pronounced the previous week’s volume (7.5 years of global supply) was a strong sign that Silver had topped. The market has found support in the low 30s and a bounce into the low 40s is possible as Silver develops its own half-mast bear pattern.

New crop December Corn has traced out a H&S top. It would not be unusual for Corn to top now.

The seasonal chart shown indicates a strong tendency for new crop Corn to top in May or June.

Finally, the daily chart of August Soybean Meal displays a very clear possible descending triangle. A close below the recent lows would complete this pattern and establish a target of 300.

Adding all things up, the period just ahead could be a tough life for raw materials (and stocks).

###