

Factor Report – March 13th
Market Review
Factor Moves are currently ongoing in:
- Gold
- Japanese Yen
- USD/NOK
- Copper
- AUD/NZD
A Factor Move was terminated in AUD/NZD. A Factor Move is developing in USD/SEK and New Zealand Dollars. This issue of the Factor also comments on the Soybean complex, Euro, Heating Oil, Canadian Dollars and global stock markets.
Factor Moves in Progress
Copper (daily chart)
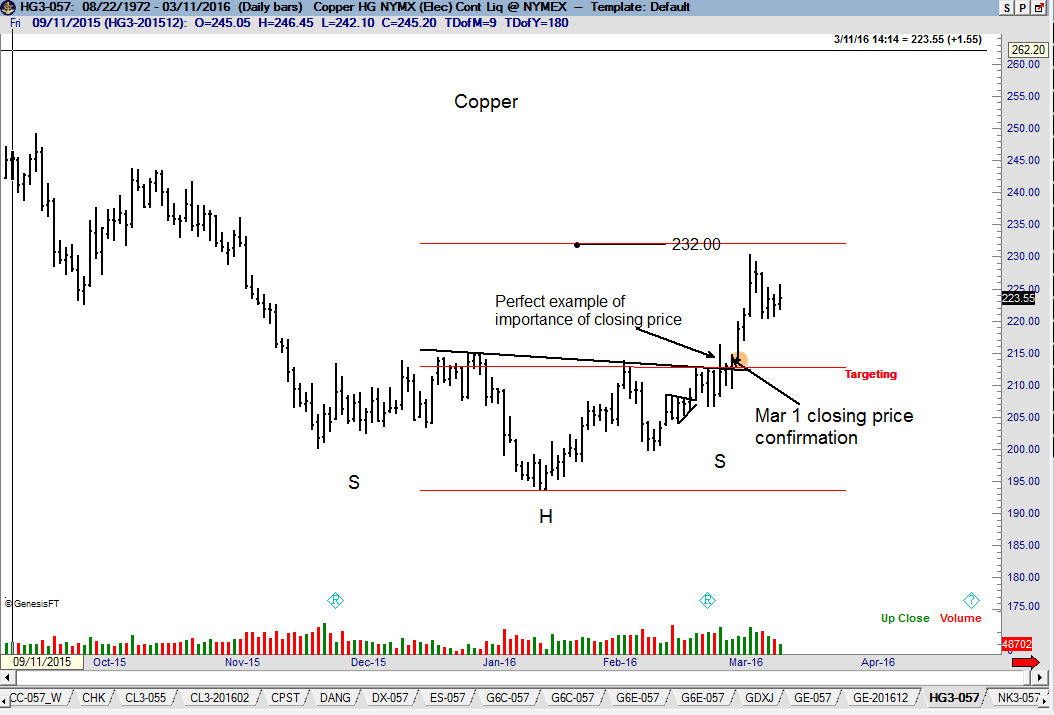
After falling from a high of 465 in Feb 2011, it appears that Copper bottomed at 193.55 on Jan 18. The advance on Mar 1 confirmed a H&S bottom. I have upped the initial price target to 231.90. An eventual test of the Oct 2015 high at 244 is likely. Factor is long one layer.
A Trading Edge – What does this mean?
“A trading edge.” This is a widely used, but mostly misunderstood concept in trading. This is the topic for discussion in this week’s Factor Update. A trading edge is the thin advantage gained over the markets by one’s trading practices. The concept of trading edge is much more pertinent to the futures and forex markets than to the equity markets because futures and forex trading are zero sum games (actually, less than zero sum games because of trading fees). In the equity markets, most everyone gains from a general bull trend except for a small short interest – and short interest players can even be right at the expense of shareholders. In futures and forex there is a short for every long. I can only make money in futures if someone else loses money. Worded a different way, I must be a skilled pick-pocket in order to profit from my trading. Newcomers to futures and forex trading often falsely believe a large edge can be gained through the selection of the market to trade and the day and price of entry – something I refer to as “trade selection” or “trade identification.” In reality, trade selection offers very little in the way of a trading edge, contrary to popular belief or the ads by the con artists claiming such things as “Right 72% of the time,” or “28% return in just four weeks.” I trade classical chart configurations, with a focus on: · Head and shoulders patterns, rectangles and right angled triangles (minimizing such patterns as symmetrical triangles, wedges and trendlines) · Chart configurations at least 12 or so weeks in duration · Measured move targets equal to approximately $3,000 per futures contract (or per a forex position with a USD value of $100,000) Do the chart patterns I attempt to identify give me an edge in trading? Yes, but only a slight edge, and then only to the degree I remain extremely disciplined and patient and apply rigorous risk management protocols. The real edge in my trading comes in three ways: 1. Getting out of a losing trade quickly and allowing a winning trade to grow in value. In other words, how and when I exit a trade is far more important than how and when I enter a trade. 2. Remaining in trades for days, weeks or even months 3. Increasing my bet size two or three fold on a very small proportion of trades (less than five per year) and being right on a few of the trades I parlay I need to comment further on #2 above. My observation is that most novice traders pursue day trading. For the life of me I cannot understand this decision. The HFT operations own the bid/offer spread (often an artificially expanded bid/offer spread) – thereby gaining the most significant edge within a trading day. This fact places an unusual burden on novice day traders to actually find an edge that works. To summarize: · Classical charting principles only offer an edge to the extent patience, discipline and aggressive risk management is used in a trading operation · The real edge comes from selectively increasing leverage, from jettisoning losers quickly and from holding onto winning trades. |
Gold (weekly and daily charts)
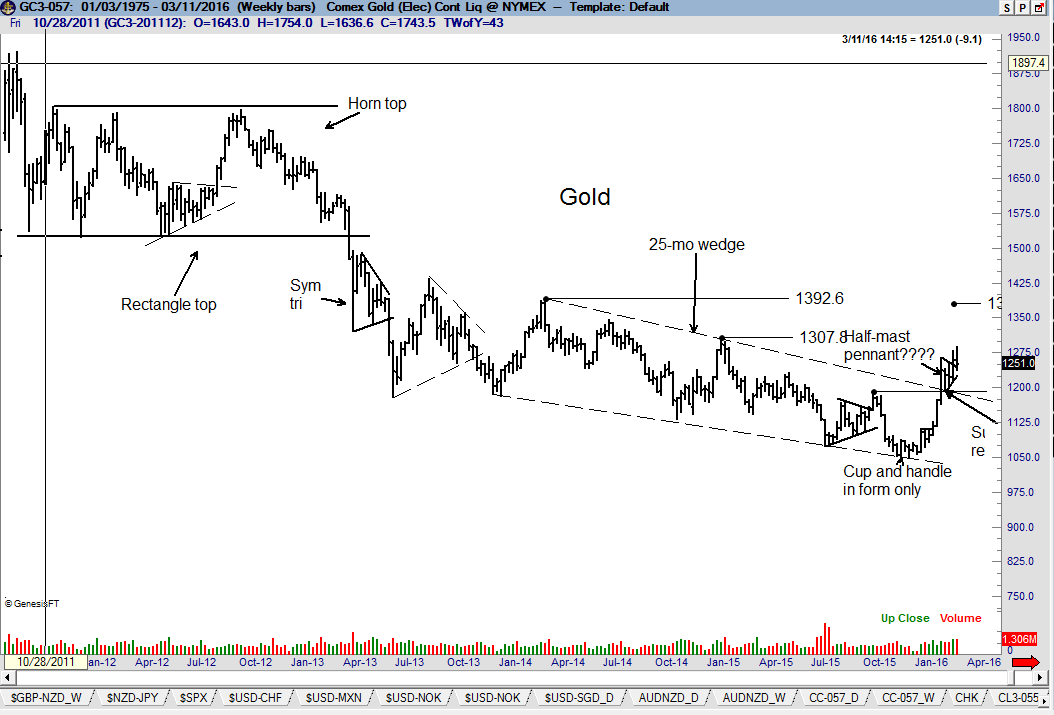
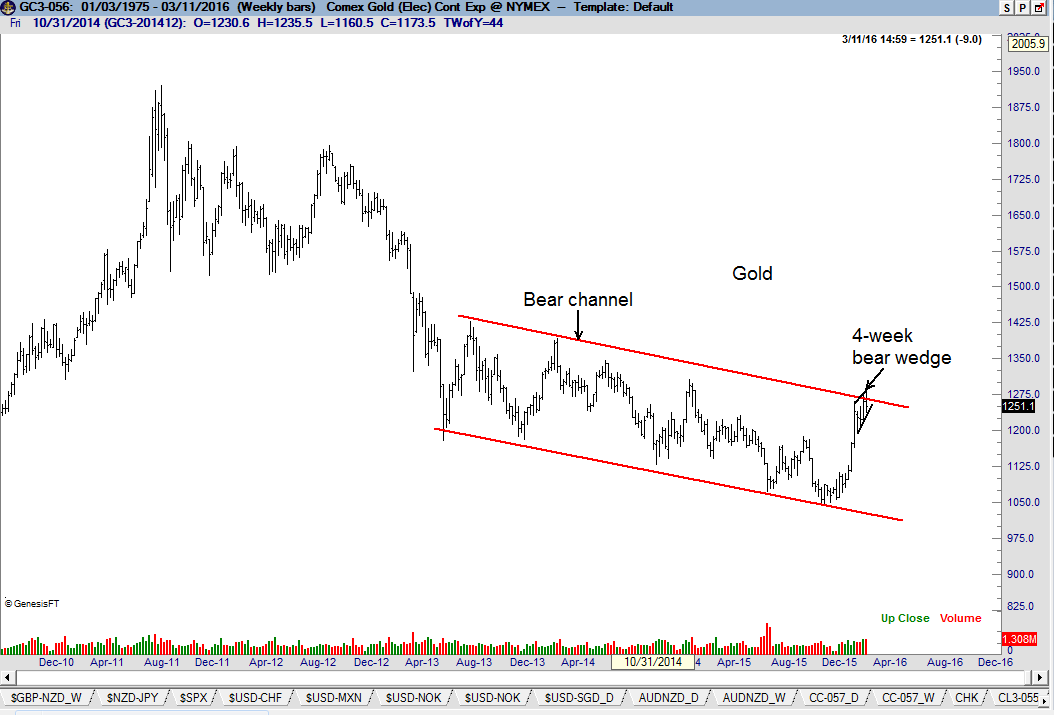
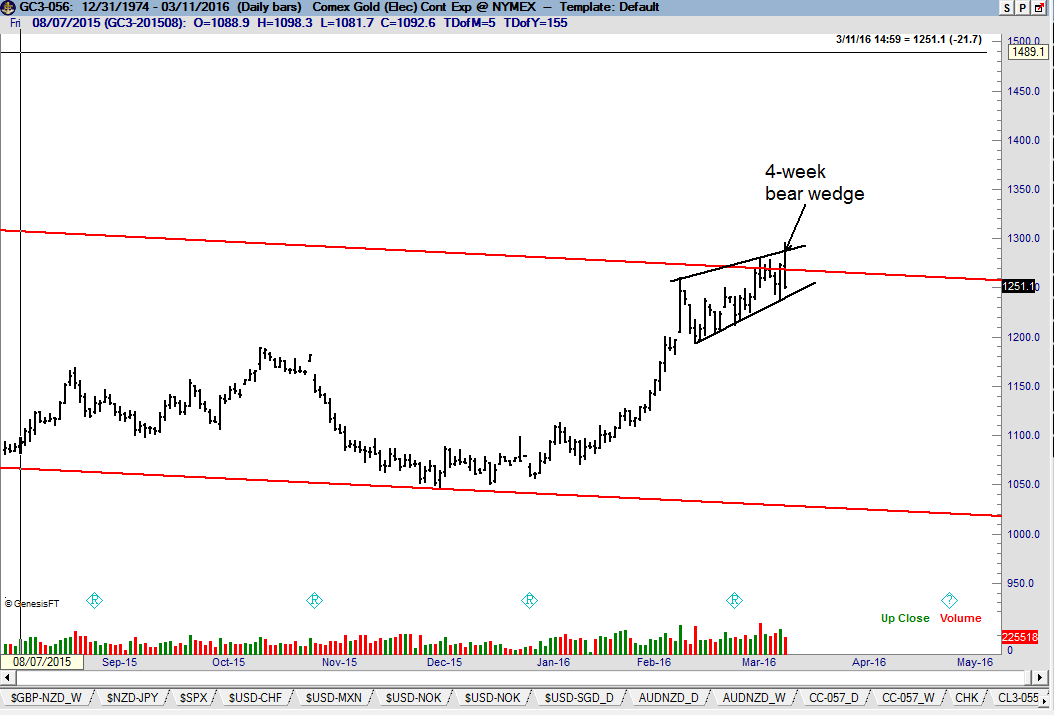
The dominant chart construction in Gold is the Feb 11 breakout of a 25-month wedge. I have cautioned in recent Updates that the wedge is a diagonal pattern (therefore less reliable) that can result in substantial backing and filling. The only chart interpretation supporting an immediate thrust is the possible half-mast pennant completed on a Mar 3 on the daily graph. But, wait! Half-mast pennants should be resolved by an almost straight line advance. This has not occurred, leading me to question the half-mast pennant labeling. While I continue to believe Gold has established a major bottom, it appears that long positions might need plenty of wiggle room (and plenty of wiggle room is not a trading practice in my toolbox). There is a second possible interpretation of the charts – it is not my preferred interpretation but worthy of mention. The bottom two charts display this interpretation. It is possible to interpret the weekly graph as an ongoing bear channel with the market currently at resistance. The companion daily chart in this interpretation shows a possible 4-week bear wedge. Factor is flat in Gold.
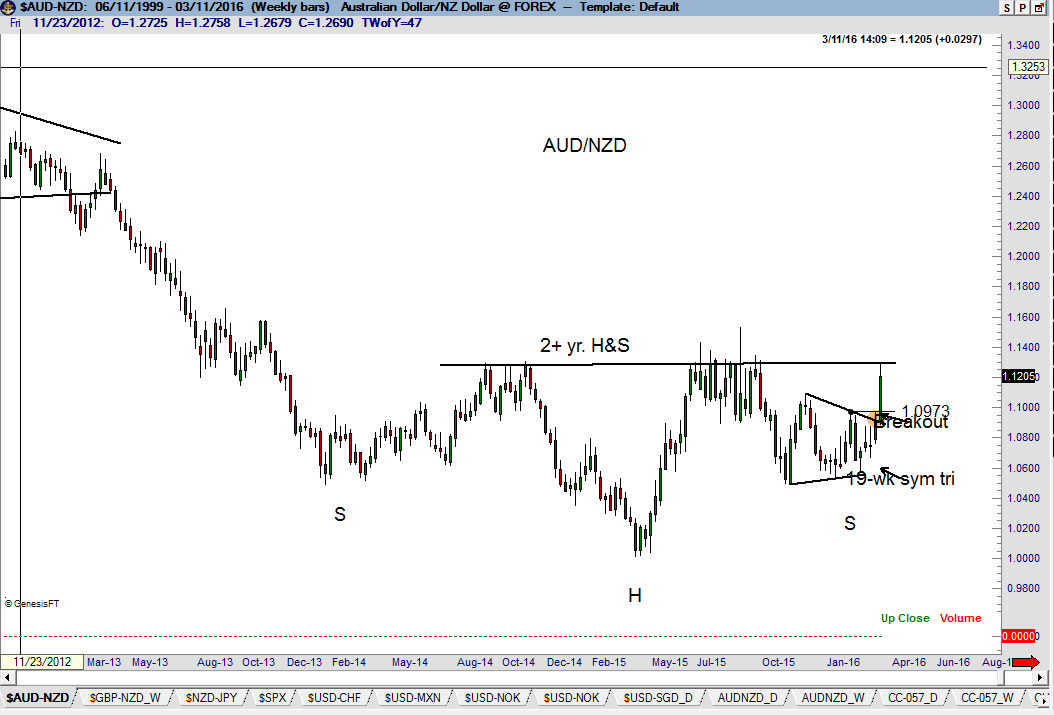
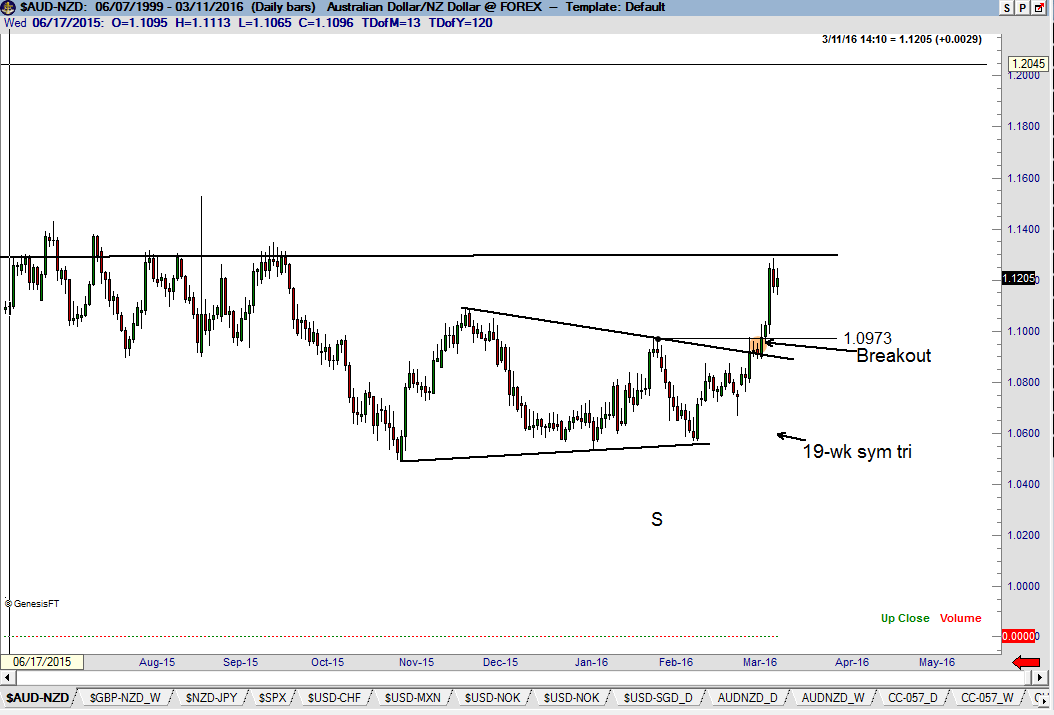
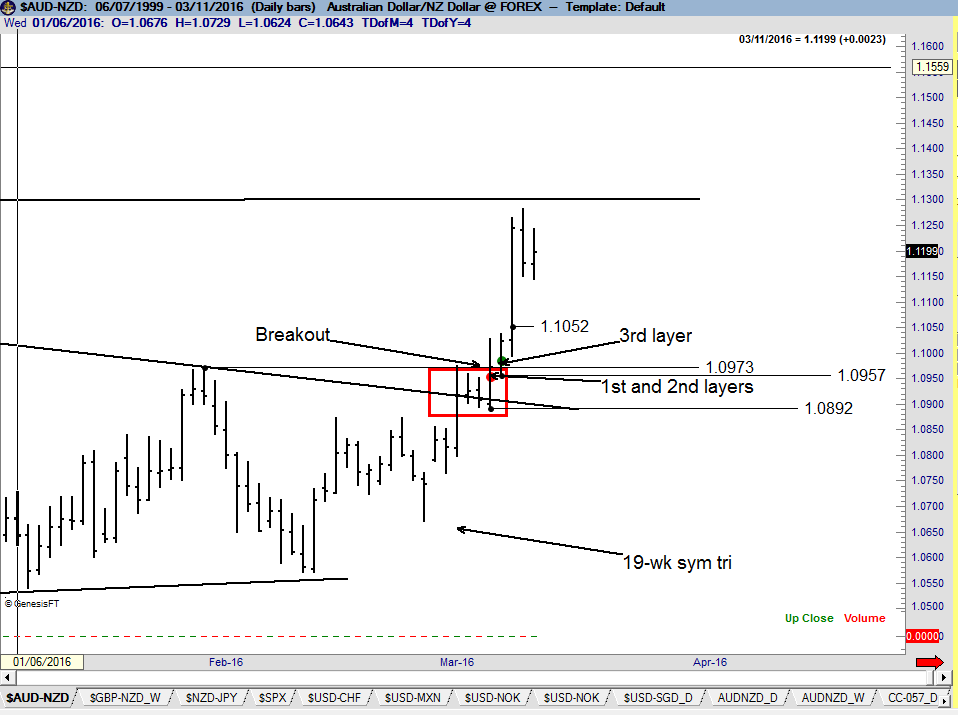
AUD/NZD (weekly and daily charts)
The Factor Update has commented on this forex pair for several months. My view has been that the weekly graph was forming either a H&S bottom or a H&S failure – and that the 19-week symmetrical triangle serving as the right shoulder of the H&S pattern would provide a big clue to the next trend. The advance on Mar 7 completed this daily chart symmetrical triangle, leading to the huge surge on Mar 9. The market is now getting into neckline resistance. Drawing the exact neckline is difficult due to the awkward nature of the right shoulder. Please note that I always attempt to draw a horizontal neckline, even if it is forced. A Friday close above 1.1400 would complete this weekly chart H&S and set the stage for an advance toward 1.2800. This trade can be executed in spot or in futures on a one-to-one basis (futures would deliver an overweight to AUD). Factor is long three layers.
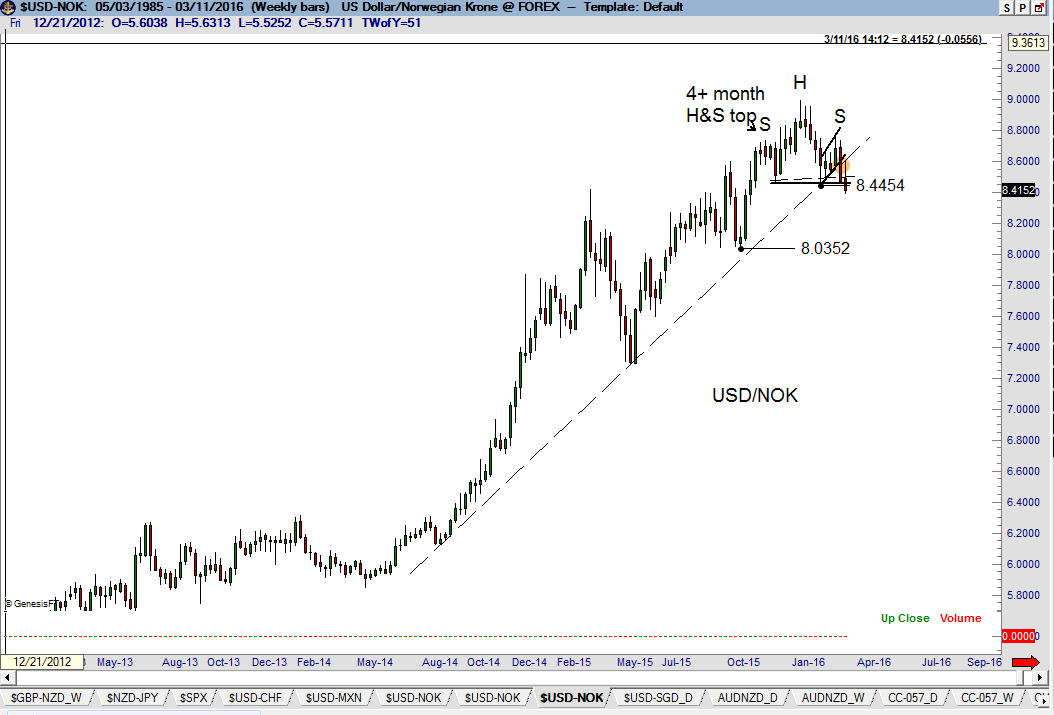
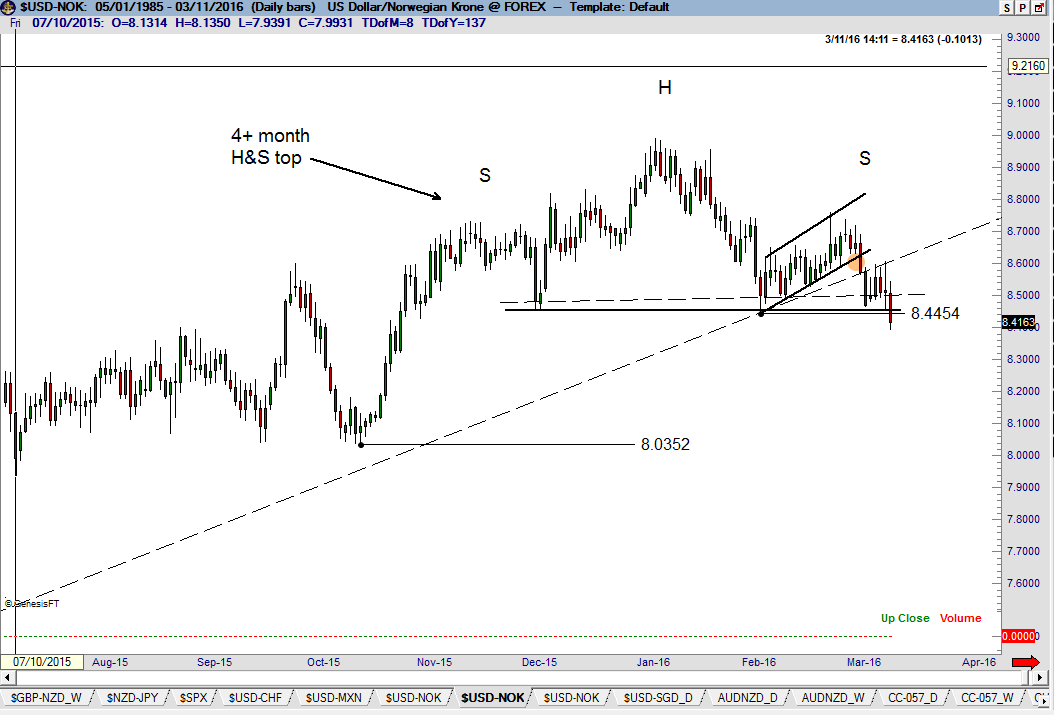
USD/NOK (weekly and daily charts)
Last week’s Update commented on the H&S pattern on the weekly and daily charts for this forex pair. Last week’s WBB decline (Mar 4) sliced through a 19-month dominant trendline on the weekly graph and completed a channel that served as the right shoulder of the H&S pattern on the daily chart. The shallow rally this past week tested the underbelly of the dominant trendline. The decline on Friday completed the H&S top. Factor is short two layers.
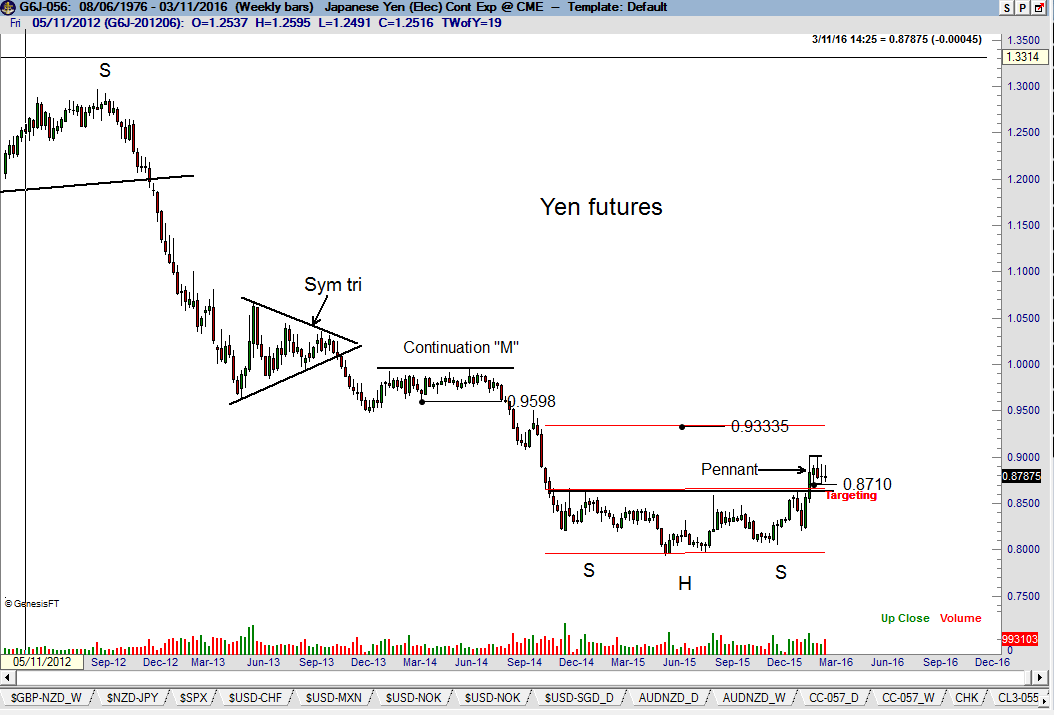
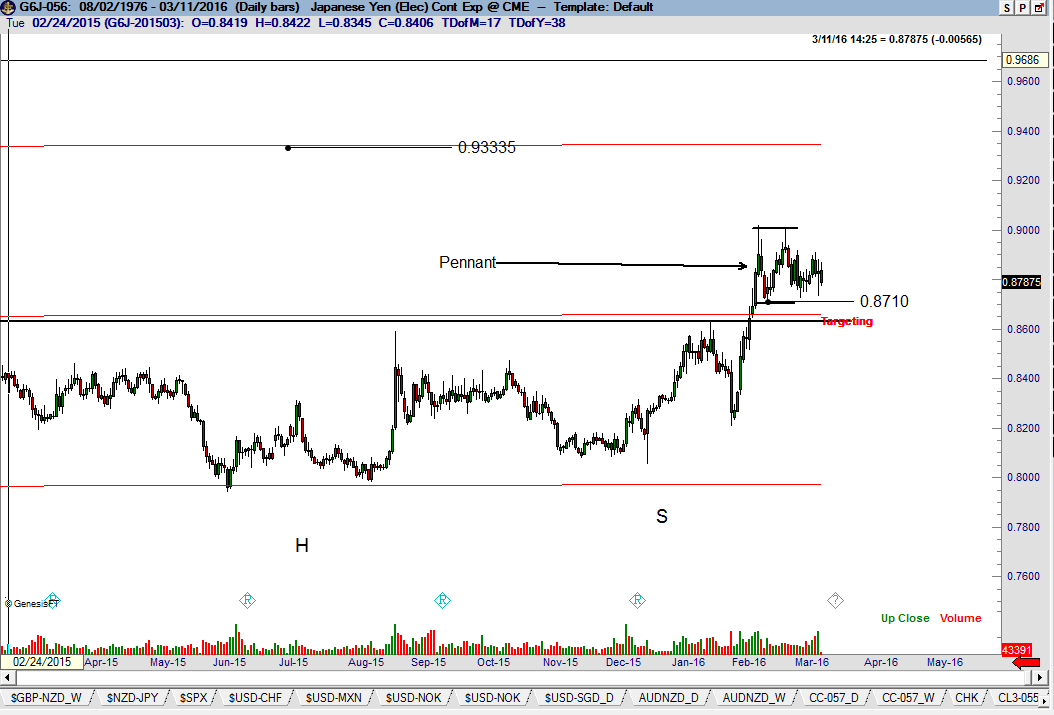
Japanese Yen futures (weekly and daily charts)
The dominant chart construction in the Yen is the Feb 8 completion of a 15-month H&S bottom on the weekly graph with an implied profit target of .9335. The market has stalled, but no damage to the bull case has yet occurred on the daily chart. A hard retest of the neckline of the H&S cannot be ruled out. A surprise action by Central Banks could result in the running of stops below .8700. The daily graph presently is forming a simple 4-week pennant pattern.
Other Markets
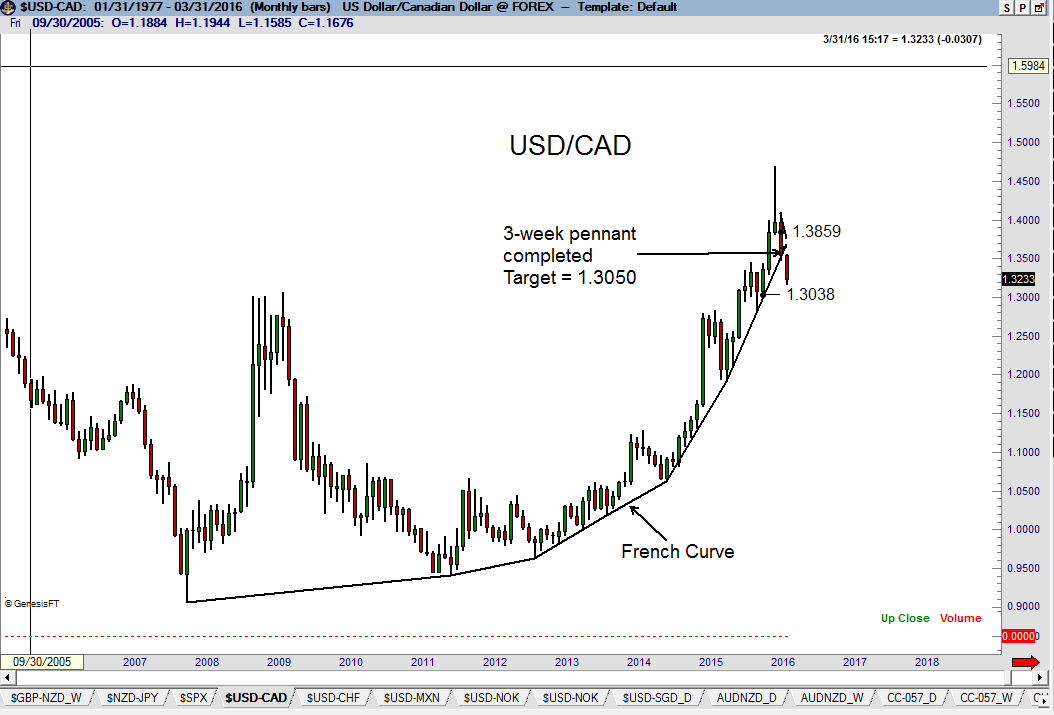
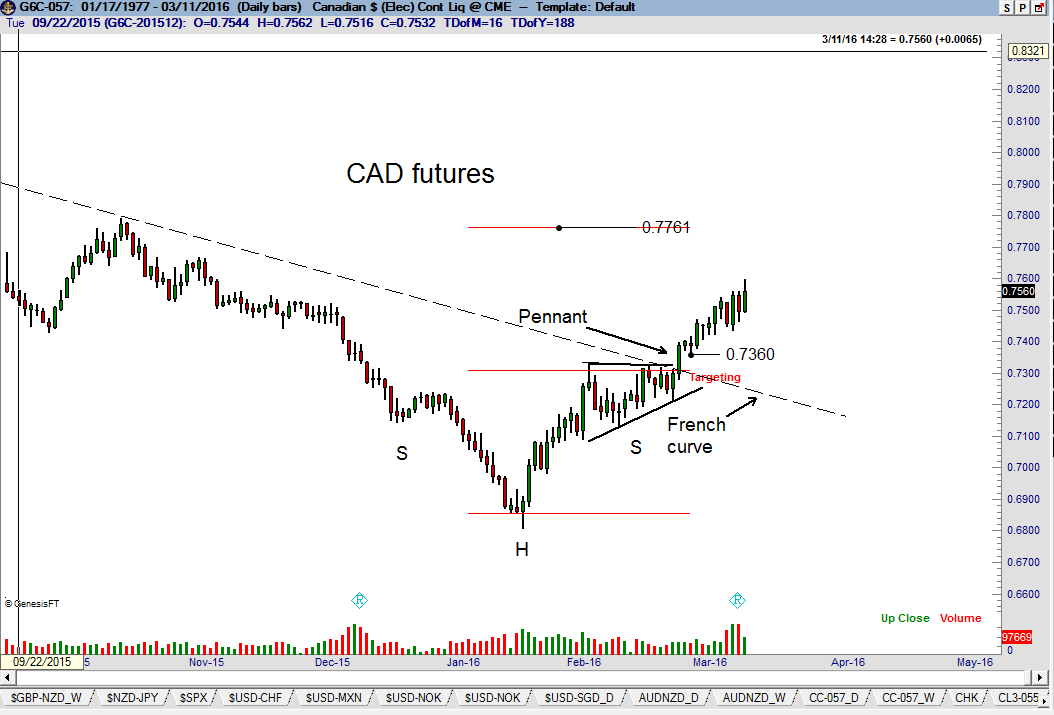
Canadian Dollar futures (daily CAD/USD futures and weekly USD/CAD spot charts)
The dominant chart construction in this market is the penetration of an 8+ year French curve on the monthly graph (USD/CAD) and the completion of a 3-week pennant on the daily graph (CAD/USD). Both events occurred simultaneously with a wide-bodied candlestick bar (WBB). The target is .7760 in futures.
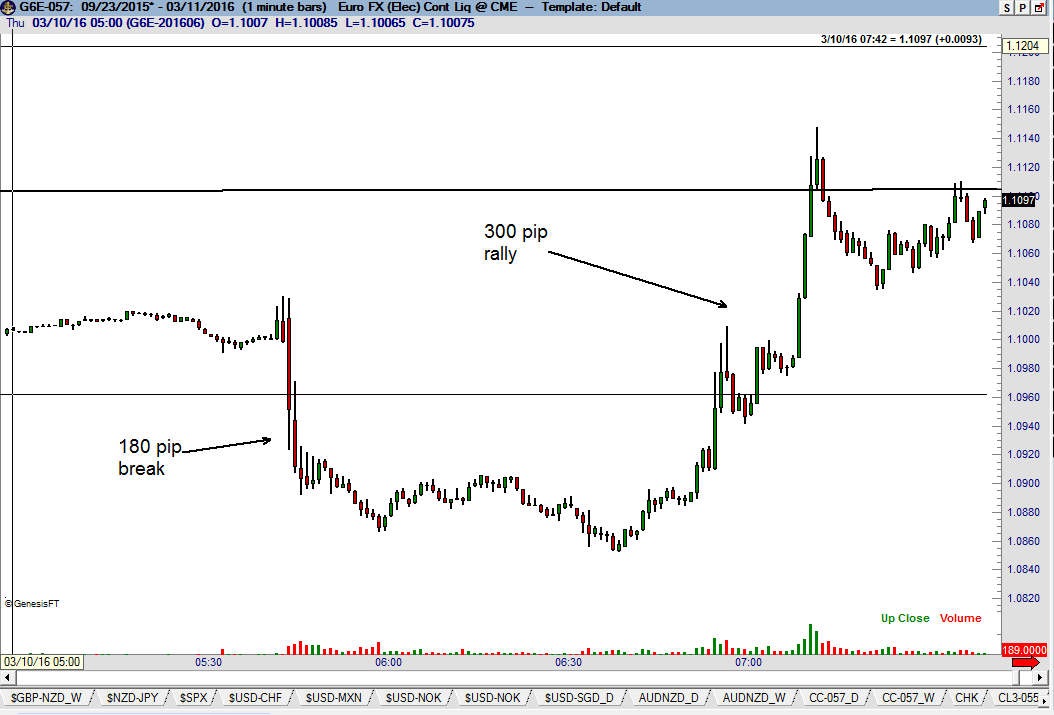
EuroFX
The 1-minute chart shows (without comment) the 480 pip travel path over a 90 minute period. I have no desire to be involved in a market that does not make sense to me. This is an example.
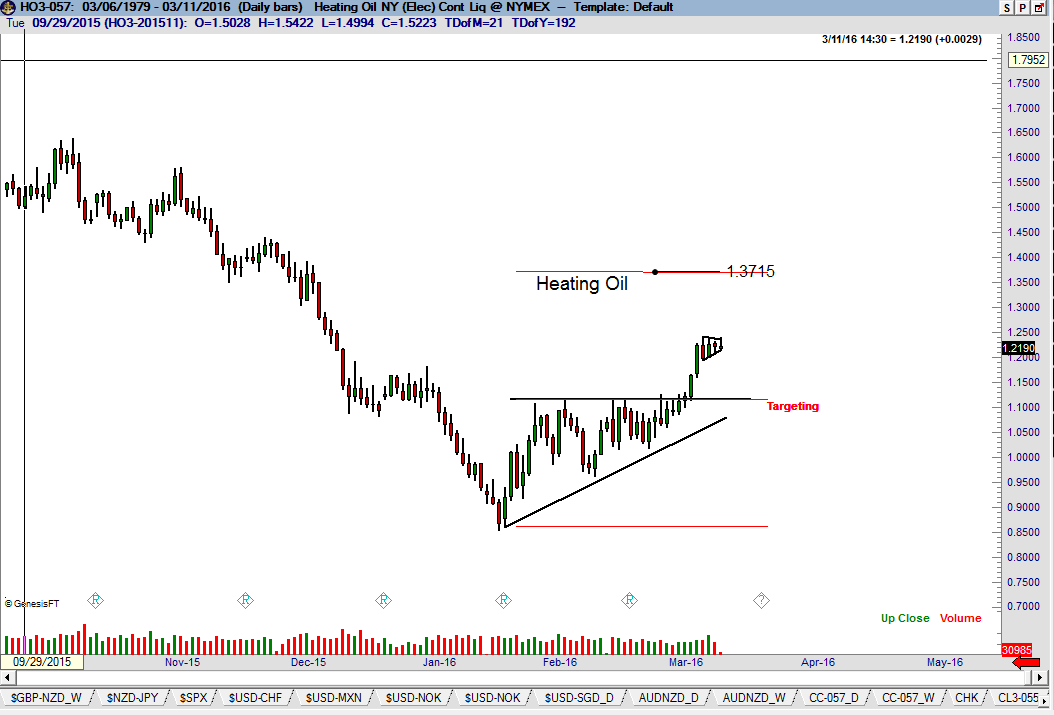
Heating Oil (daily chart)
While I focus on weekly charts, daily chart often provide tight little patterns that offer the opportunity for swing trades. The advance on Mar 4 completed a 6-week ascending triangle in Heating Oil with a target of 1.3700.
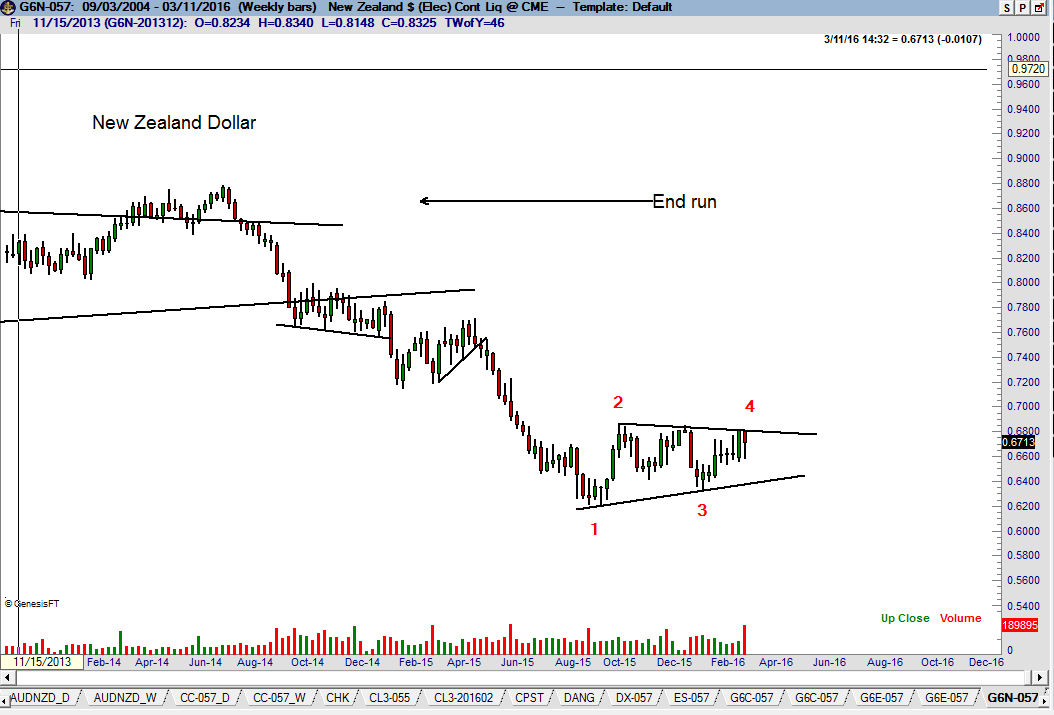
New Zealand Dollars (weekly chart)
The possibility exists that NZD is forming a 6-month symmetrical triangle – this requires that the Kiwi turns down from current levels. The completion of a continuation pattern would provide a possible target of .5900, then .5500.
Why I trade futures and forex markets
Besides the fact I started as a futures trader, there are several reasons I have remain primarily a futures and forex trader.
- As levered markets with low margin requirements, futures and forex trading allows for much more flexible cash management (more on this in a later Update)
- Futures and forex markets are extremely liquid
- Futures and forex markets are open 23-1/2 hours per day
- Futures markets have a preferred 60/40 tax treatment for U.S. residents
Q&As from ReadersQuestion from Michael Sinclair, North Carolina Peter, you often refer to the importance of the closing price. Why is the closing price any different than the open price or the high or lows prices? Answer: The vast overwhelming portion of volume each day in most markets come from HFT operations and day traders. Some estimates place HFT trading at 60% (+/- 10%) of the daily turnover, depending upon the market. HFTs and day traders are in and out all day long, but go home flat before the daily close so that they are not carrying a position overnight. The net result is that the closing price each day represents price discovery by only those traders willing to take overnight risk and put up overnight margin. In a real sense, the closing price line graph represents where position traders think a market should be priced while the high/low bar chart represents noise. I am not fond of being sucked into a trade or forced out of a trade based on intraday noise. The chart to the right illustrates intraday noise. Note the thick black closing price line. Most of the price action above and below the closing price line represents noise. I use the phrase “most of the price action” because some of the price action represents real price discovery. I would love to have a tool that distinguishes the discovery price range from actual high/low range. Without such an analytic tool, I look at true range bars (opening to closing range) as a proxy for the price discovery range. Given the discussion above, hopefully you can now appreciate the importance I place on Friday closing prices. Position traders must risk a position and cover a margin requirement over the weekend – so I consider this to be the most important single price of the week. It has been my trading practice to liquidate any and all losing trades at the close on Friday. I make very few exceptions to this trading rule.
Question from Bryan Scott, New Zealand Your advice on money management and mental attitude has hugely shaped my thinking in last 2 years. Always keen to tell you that. I’ve been trading principles of Edwards and McGee for 4 years and am very pleased with results. In previous updates you have alluded to trading much more aggressively when you were younger. Could you elaborate on this? (From memory I believe you had a crazy 600% year.) Given your love of probability theory I presume you didn’t simply consistently increase risk per trade to crazy 2% or 2.5%, bringing risk of 40% drawdowns…… (Or did you?) My only other thought was that previously you 1) more aggressively chased anticipatory minor patterns before a major break out 2) swung at more minor patterns in general 3) very selectively with gut feel and knowledge increased leverage, maybe 8 times year to 2 or 3 %? I am a relatively young 40, the only money in my brokerage account is money I have taken out of the market and I want to combine a more aggressive stance without simply adding to leverage. I know this sort of advice is not for everyone, you may not even wish to publish it for sake of encouraging wrong attitudes but would be great if you could address this in a newsletter or few words in reply. Answer: Your option #3 is correct, but only two to four trades each year with a risk of 2% to 3%, although in early years I took risks of up to 5%. It was a stroke of luck I was not carried out on a stretcher. It scares me to think back on such risk levels. An example might best answer your question. My typical trade in Sugar might risk 70 ticks, or about $800 per contract. Thus, a 1 contract per $100k trade represents an 80 BP trade – this is about my average risk per trade. Next, let’s assume I develop a very high confidence in a Sugar trade (perfect set up) to the degree I am willing to take a 200 BP risk with the belief I will be able to clamp down my risk to 100 BPs within a day or two of entry. And, let’s assume that I am able to enter this trade with a risk of only 25 ticks. The net is that my position becomes six or so contracts per $100k. But, these types of set ups occur very few times each year, if they develop at all. There was one recent trade that almost (but did not) qualify this year – the long CAD futures trade in late Feb. |
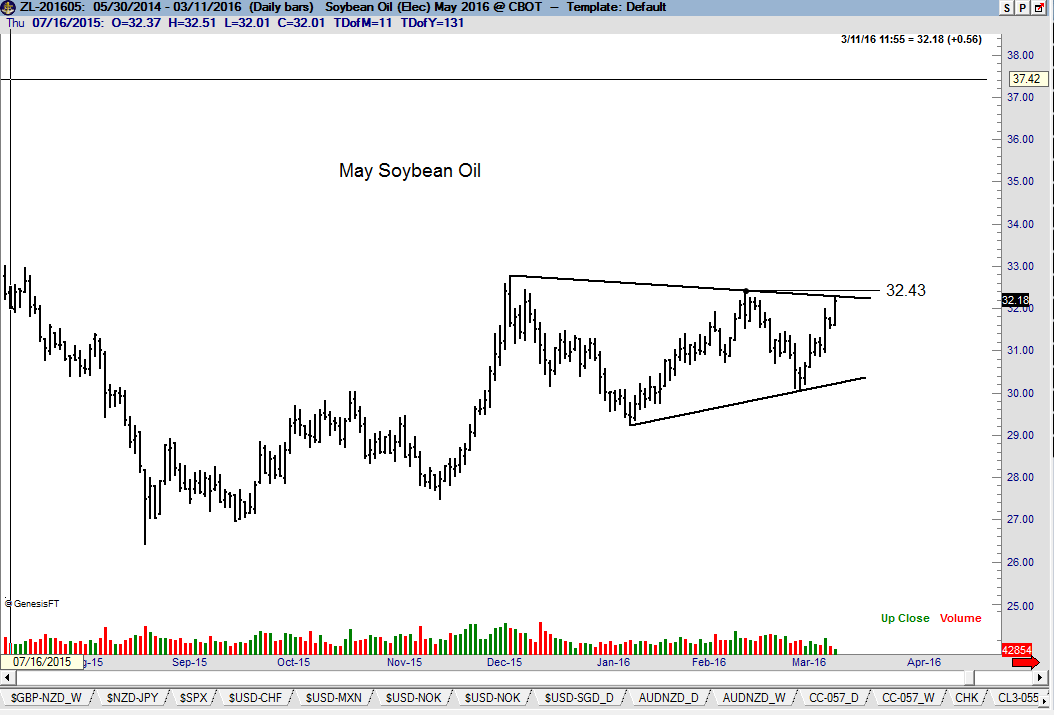
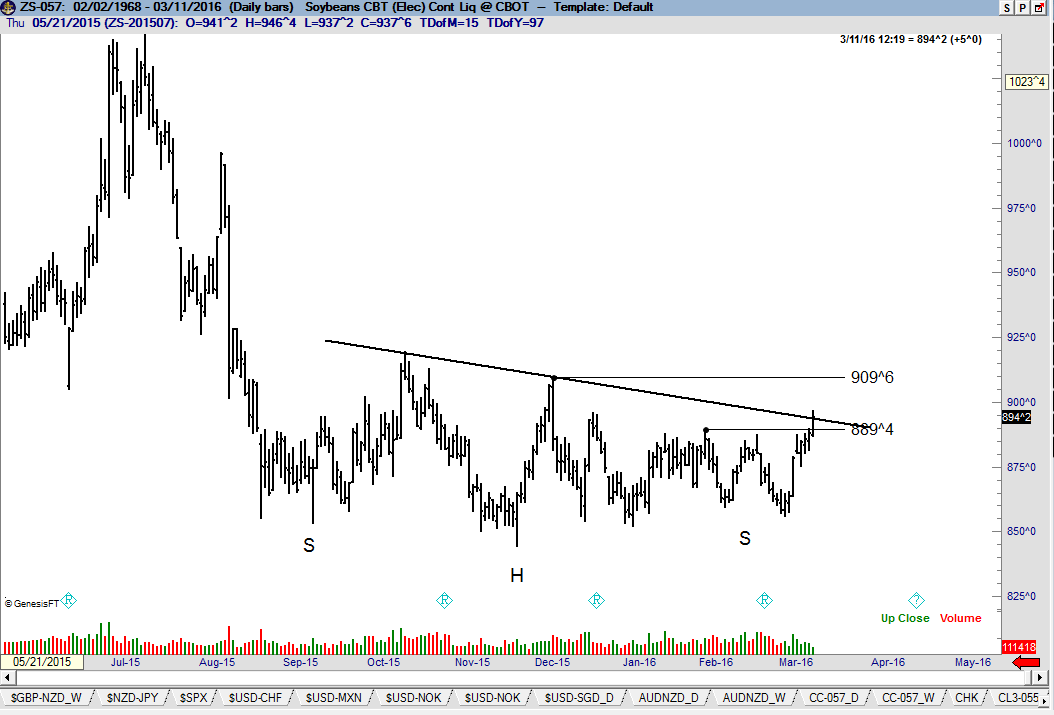
Soybean Complex (Soybean Oil daily chart, Soybeans continuation weekly chart)
Many of you have inquired on my views on the grain markets. I have a difficult time getting excited about the long side of Beans, Corn or Wheat based on the daily graphs of the individual contract months. The daily charts display massive trading ranges in these markets. However, two interesting chart patterns do appear. The daily graph of May Soybean Oil is forming a 3+ month symmetrical triangle. A close above 32.60 is required to complete this pattern. The problem with this pattern, of course, is that symmetrical triangles are notoriously unreliable and typically morph into larger and larger patterns until the day the market might declare itself. The second chart of interest is the weekly Soybean continuation graph. This chart has arguably formed a 7-month H&S bottom pattern. The problem is that the same pattern does not appear on the charts of any of the individual contract months — and for me this is not an insignificant issue. The second problem is that grains have a strong seasonal to top out in May. Counter season moves can occur – but typically occur when the previous year was short cropped (the saying is, “short crops have long tails”). Nevertheless, I went home Friday with a light long position in Beans, fully expecting that the charts will morph. I am second guessing my long position even as I draft this Update – and I absolutely hate second guessing trades. Second guessing is a dreadful thing for traders to do.
U.S. Stock market
An analysis of the chart structures of the U.S. stock market indexes continues to portray a negative outlook. The rally from the Feb 11 low has tested the resolve of market bears. Yet, this advance must be viewed within the perspective of weekly charts.
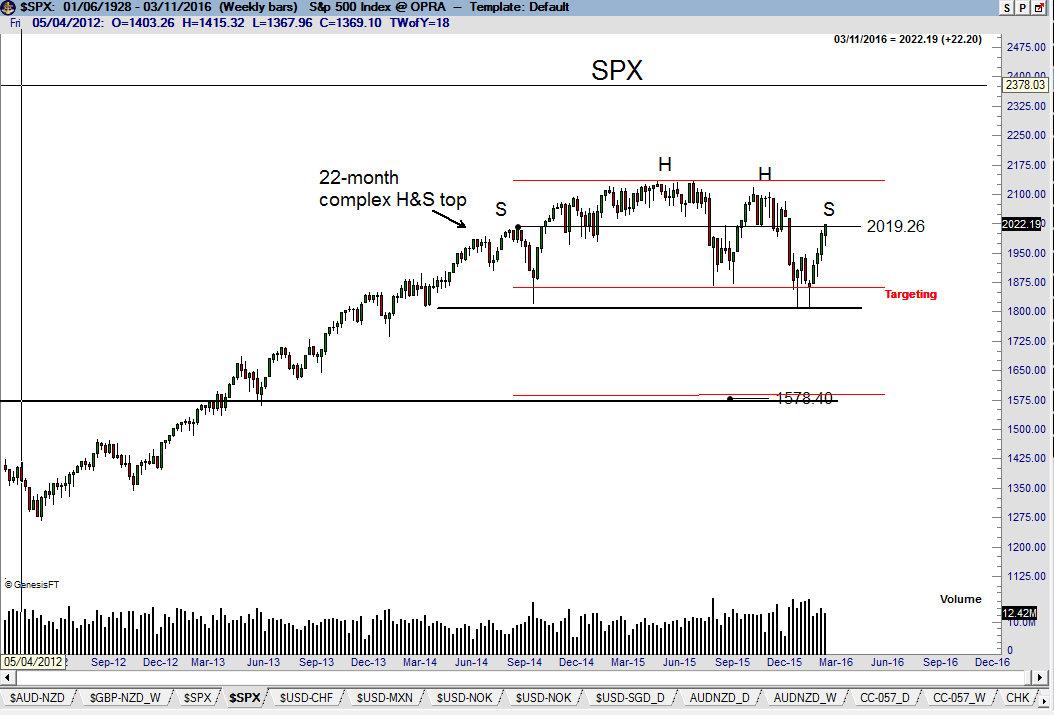
SPX continues to form a possible 22-month double-headed H&S top pattern on the weekly graph. Please note in the inset (red boxes) that the double heads were an independent H&S top, then a horn top on the daily chart – both patterns with bearish implications. I had thought that the right shoulder high on the weekly graph would not exceed the level of the left shoulder high at 2019.26. Yet, the rally on Friday pushed to 2022.37 – what is three S&P points among friends? This H&S top interpretation would gain additional credibility if the current rally falters between Friday’s level and the unfilled gap on the weekly chart at 2042.63 from Jan 4.
Market bulls argue that SPX could be building possible H&S top, but that a H&S pattern is not a top until the neckline is violated. This argument has strong merit on its face. As an adherent of classical charting principles (formulated by Richard W. Schabacker in the late 1920s and early 1930s) I must yield to the argument that a H&S is only a H&S once it is completed.
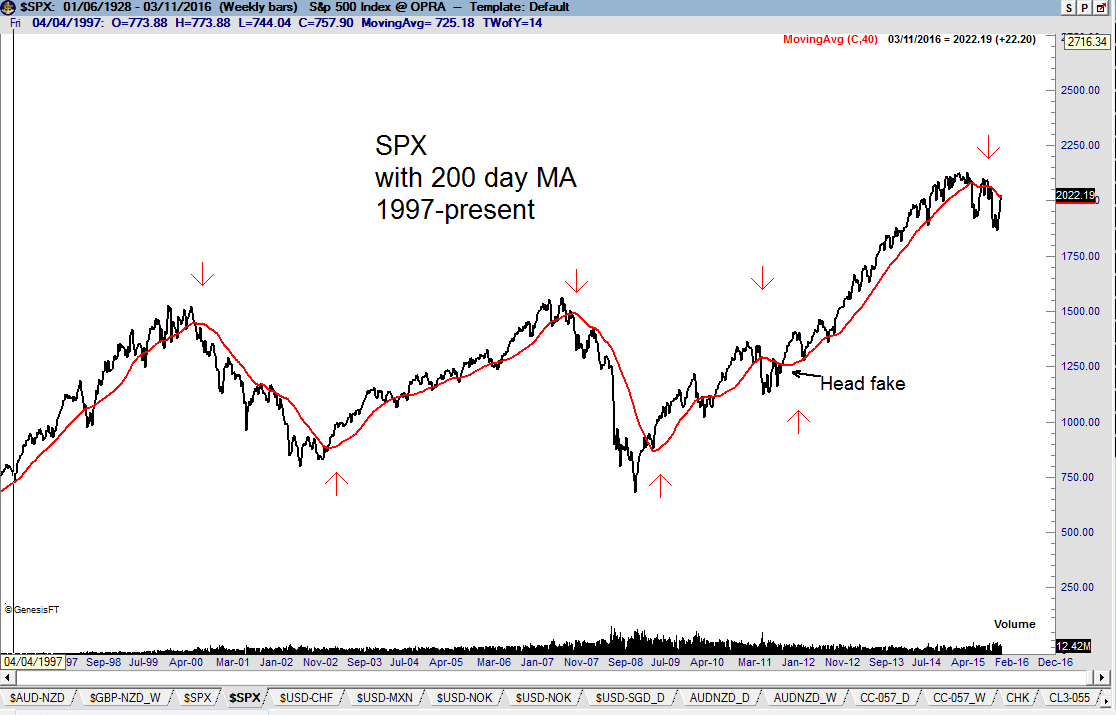
Yet, other technical factors should be considered when formulating an overall chart-based opinion of U.S. stock indexes. On such factor is the popular 200-day moving average, given great credence by many market followers. The 200-day MA has quite accurately tracked the trend of SPX for the past twenty five years, with the except of a false sell signal in Aug/Sep 2011, as shown on the weekly graph below. The 200-day MA has turned down for only the fourth time since 1990. Note that the current rally is retesting the now-down-slanted 200-day MA. For those who refute the use of moving average measures, it must be emphasized that this particular moving average has added significant Alpha compared a buy-and-hold strategy benchmarked to the S&P 500.
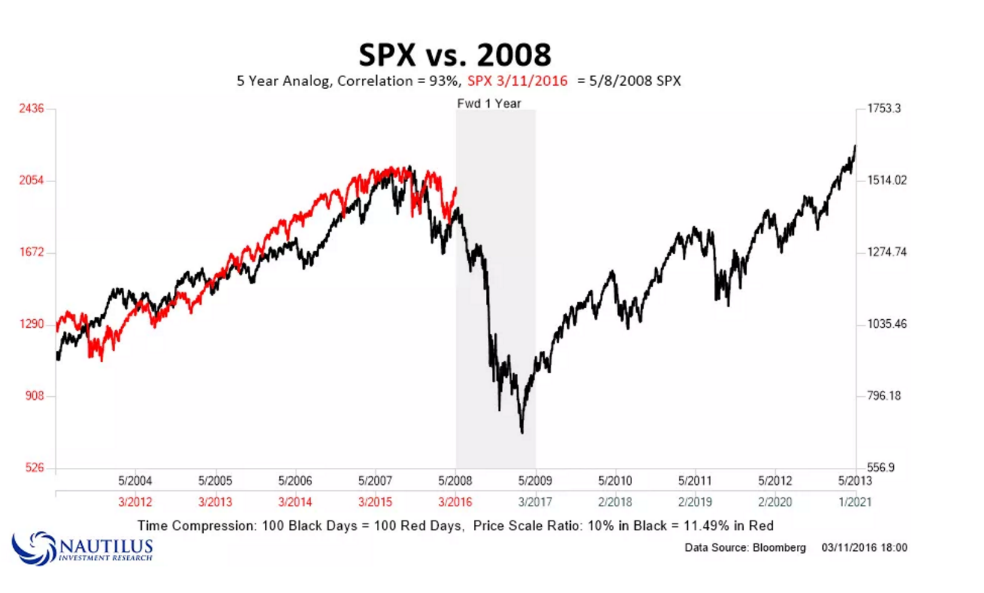
Classical charting principles are, at their foundation, based on the concept of market analogs. Market analog proponents (including this author) hold that certain time/price/geometric patterns reoccur with similar subsequent outcomes. The graph to the right (courtesy of Nautilus Investment Research) calculates the past five years in the S&Ps at a 93% correlation with the S&Ps as of May 2008. Should this analog continue to unfold, a significant decline in the S&Ps lies just ahead.
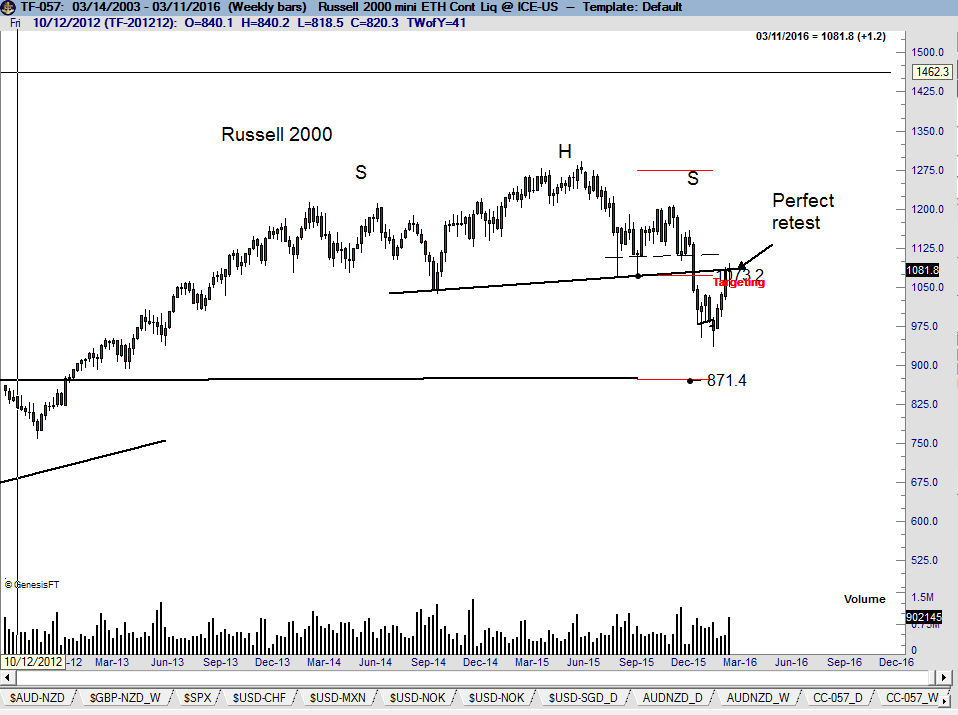
 Another technical factor to consider in appraising the condition of the U.S. stock market is the broad-based Russell 2000. This index has a confirmed H&S top and the recent rally appears to be nothing more than a serious retest of the neckline.
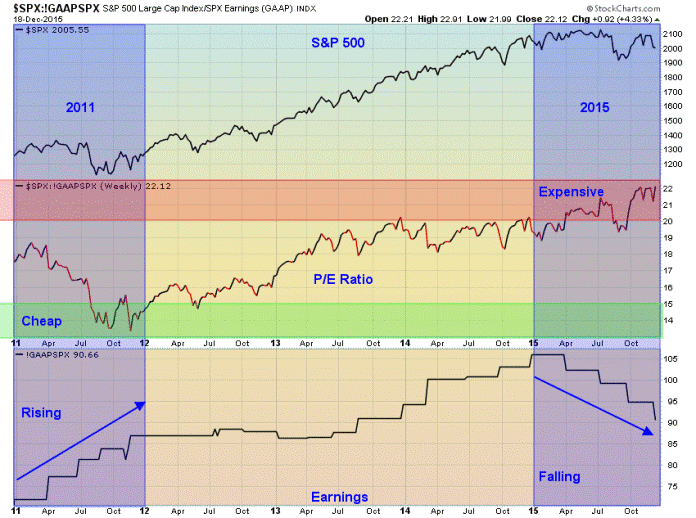
Factor LLC does not directly include macro or micro fundamental factors in its trading decisions. Yet, the graph (right) might suggest that the S&P Index is grossly overpriced. I will let this graph speak to you directly because I feel unqualified to comment on global macro of fundamental conditions.
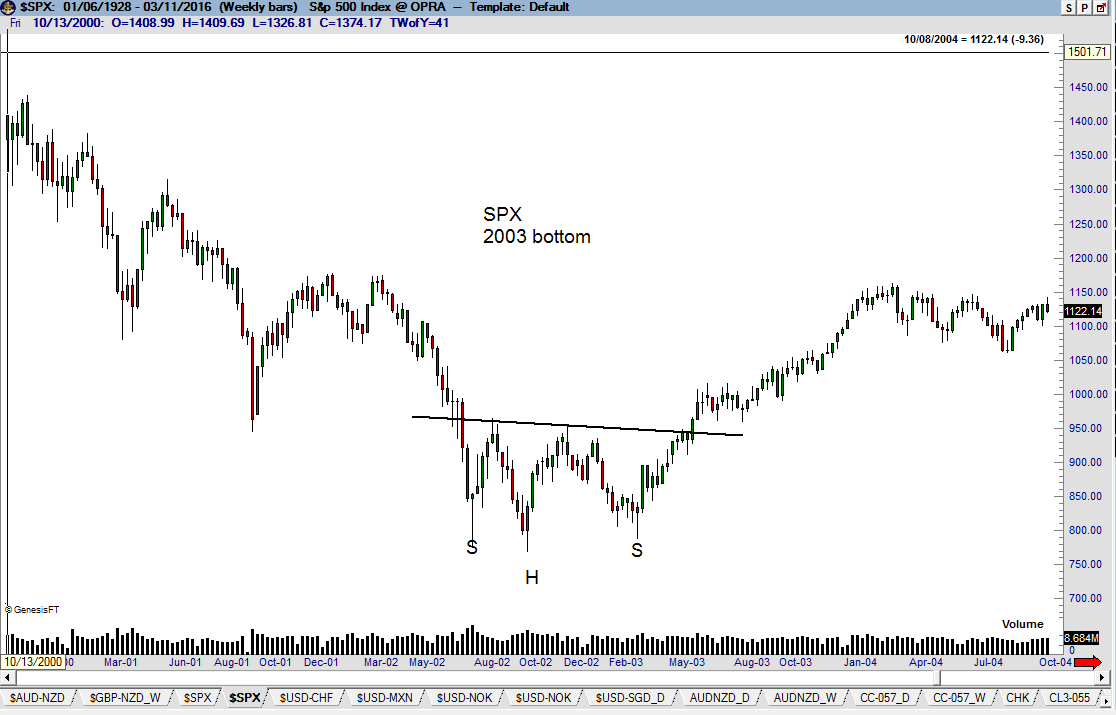
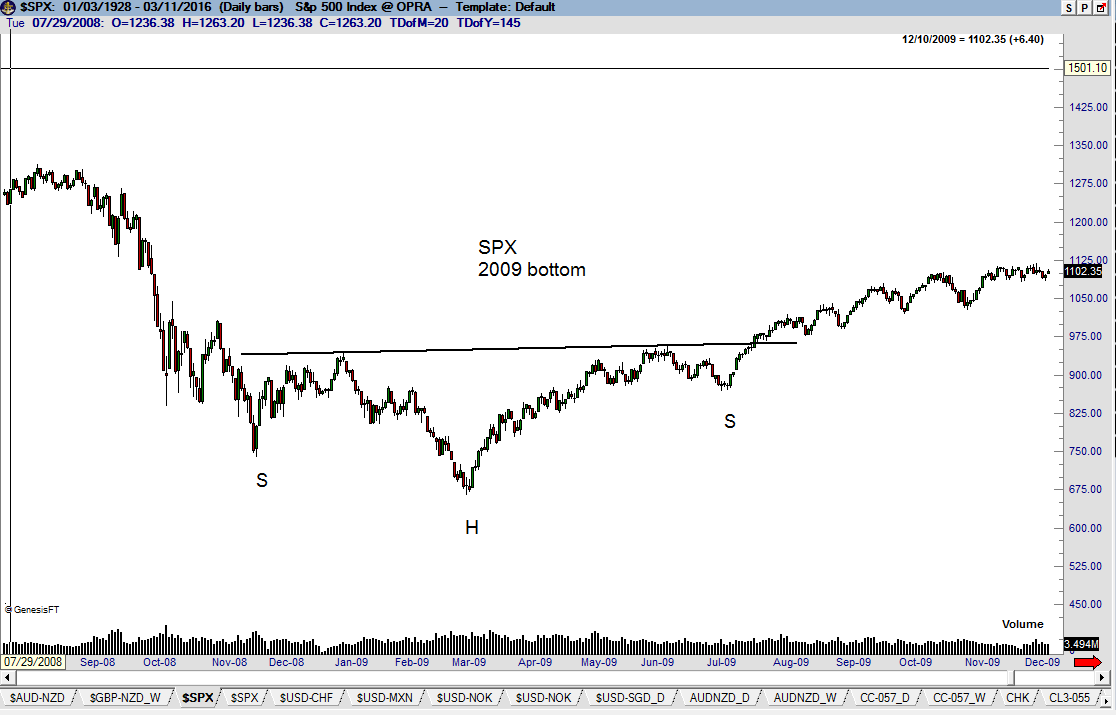
Some market bulls argue that the U.S. stock market indeed experienced a bear trend beginning in mid 2015, but that the bear market is over and the bull trend has recommenced. I flatly reject this line of reasoning. “V-extended” bottoms are extremely rare to the point of not being a consideration at this point in time. For reference, the charts below show the S&P 500 bottoms completed in 2003 and 2009. In both cases, the bottoms required time and took the form of classical H&S bottom patterns.
Summary
As a trader, I must hold in great respect the recent 4-week rally in the U.S. stock market indexes. I am not short stock index futures and have no obligation to be short even when my analysis of the market is negative – which is the case. I continue to believe that the S&Ps are constructing a formidable H&S top. The current rally does not negate this interpretation, at least not yet. However, U.S. stock indexes must begin to roll over soon and with some vigor in order to legitimize a bearish analysis. A decision by Factor LLC to be short a stock index futures contract will be based on the recognition of a bearish chart pattern on the daily graphs. No such chart pattern has begun to form.
It is always best, when short, to be short the weakest market – and when long, to be long the strongest market. The Russell has been the weakest of the major stock indexes. The strongest stock index currently is the Dow Utilities Index, bid up by wealth managers seeking yield where every it can be found. A futures contract is not available for Dow Utilities.
As a trader, my bias is to be short the Russell. I will monitor the Russell on the daily graph for signs the current rally has become exhausted. I also recommend owning individual equities reaching 52-week highs and launched with expanded volume from recognizable classical chart configurations. Identifying these individual stocks is outside the domain of this particular report.
Global stock index markets (various charts)
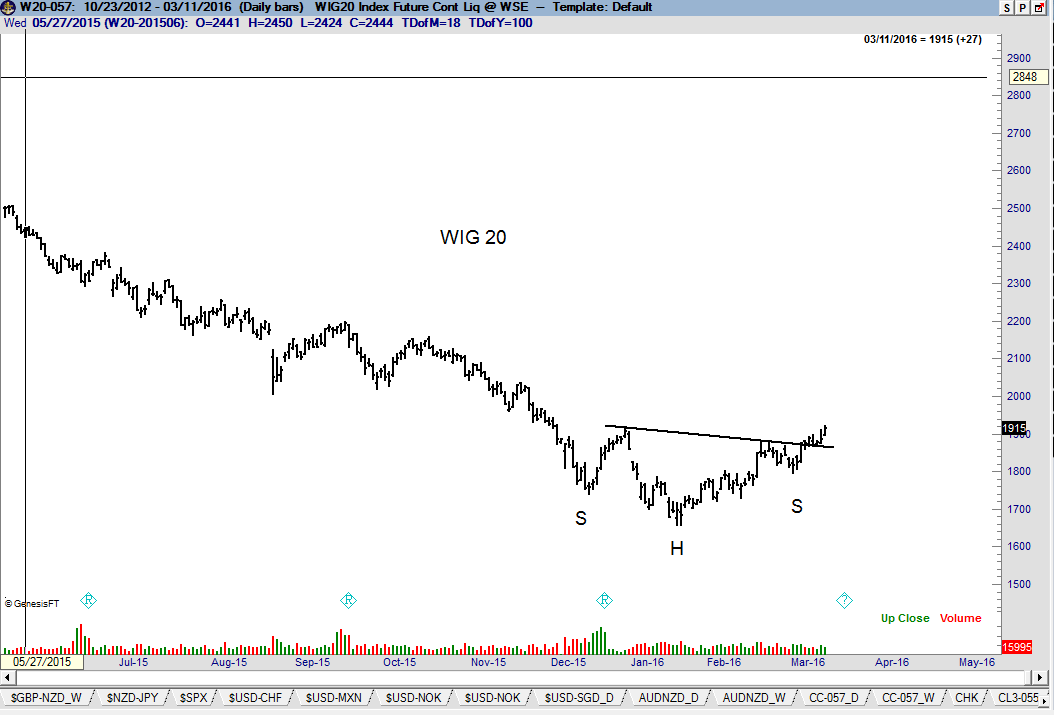
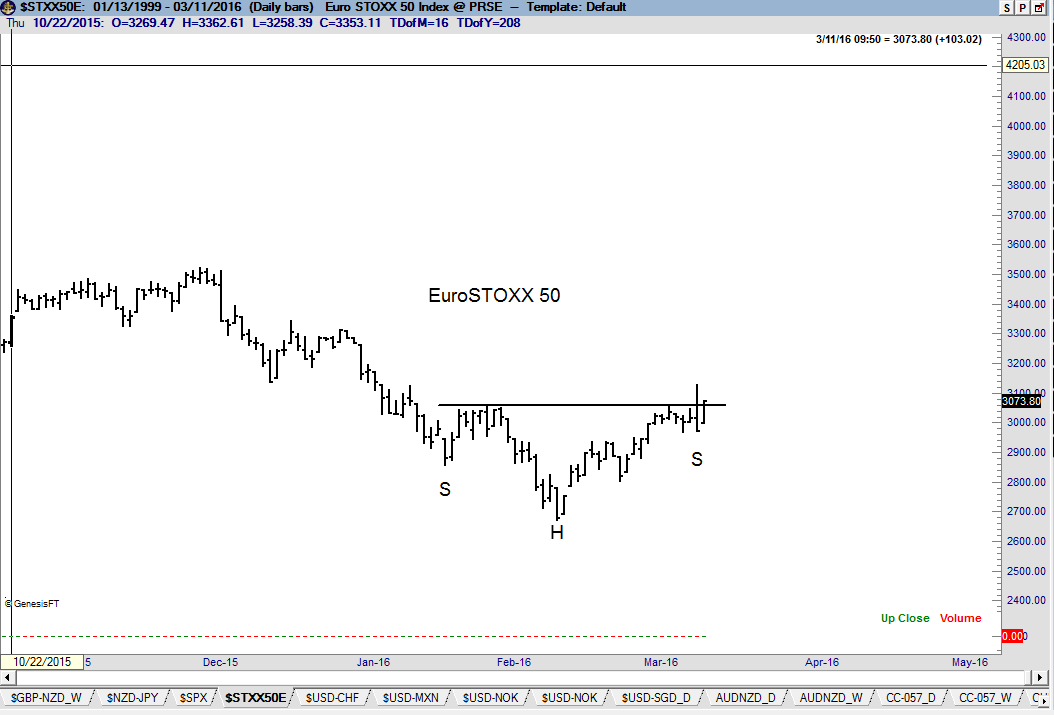
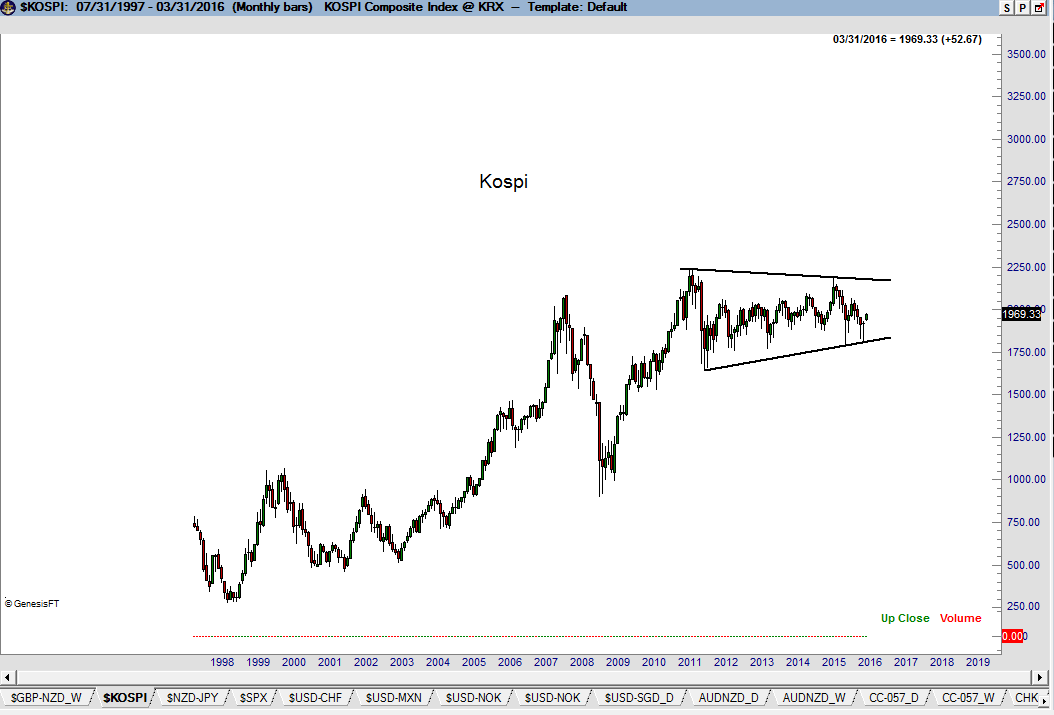
The WIG20 (Poland) displays a H&S bottom pattern. A number of other global indexes are quite interesting. EuroStoxx 50 has now completed a weird looking H&S bottom with a gimpy right shoulder. The Kospi is forming a possible symmetrical triangle on the monthly graph, as shown. I went home with a light long position in EuroStoxx, but I must admit that my win rate in European stock indexes is quite dismal.
The Death Spiral
I will attempt to explain a trading practice I refer to as the Death Spiral. I will use the current May Soybean chart to exemplify the Death Spiral. May Beans have been in a 35-cent range of 855 to 890 for 15 weeks. Nearby Soybeans have basically remained in a 50-cent range for seven months. Let’s say you have been bullish on the price of Soybeans – you have thought the market was ready for a massive price explosion. When the market had a strong surge for a day or two you went long, thinking … “This is it, we are on our way.” But, then the advance faltered and the market broke. You stopped yourself out with a loss. This happened over and over again. Suddenly you realized you had lost 150 cents in 35 cent trading range. You have bought strength and sold weakness over and over again and the market has gone nowhere. I call this the Death Spiral.
You can translate the Death Spiral into many markets. Some trades have, no doubt, found themselves in a Death Spiral in the currencies or the S&Ps. In my experience, the Death Spiral is the second most common cause of trader failure – the first is trading too big a size relative to capitalization.
My observation in hearing from traders caught in the Death Spiral is that there is only one sure way out, and it requires three steps. First, traders caught in a Death Spiral must exit all positions and separate themselves from any trading for a month or two. Second, such traders must clarify in their own minds what a trade is and is not in their respective approaches to speculation. Third, such traders – when they return to trading – must cease to pay attention to market action during trading hours and only enter trades during non-market hours. Being glued to a computer screen is typically the major cause of the Death Spiral.
Continually I warn traders against the dangers of buying bulges and selling breaks within a confined trading range. How do I know this is a dangerous practice? Because I have made every mistake possible over the years – some of them more times than I would like to admit. Profitable trading comes from developing the discipline NOT to engage in counterproductive behaviors.
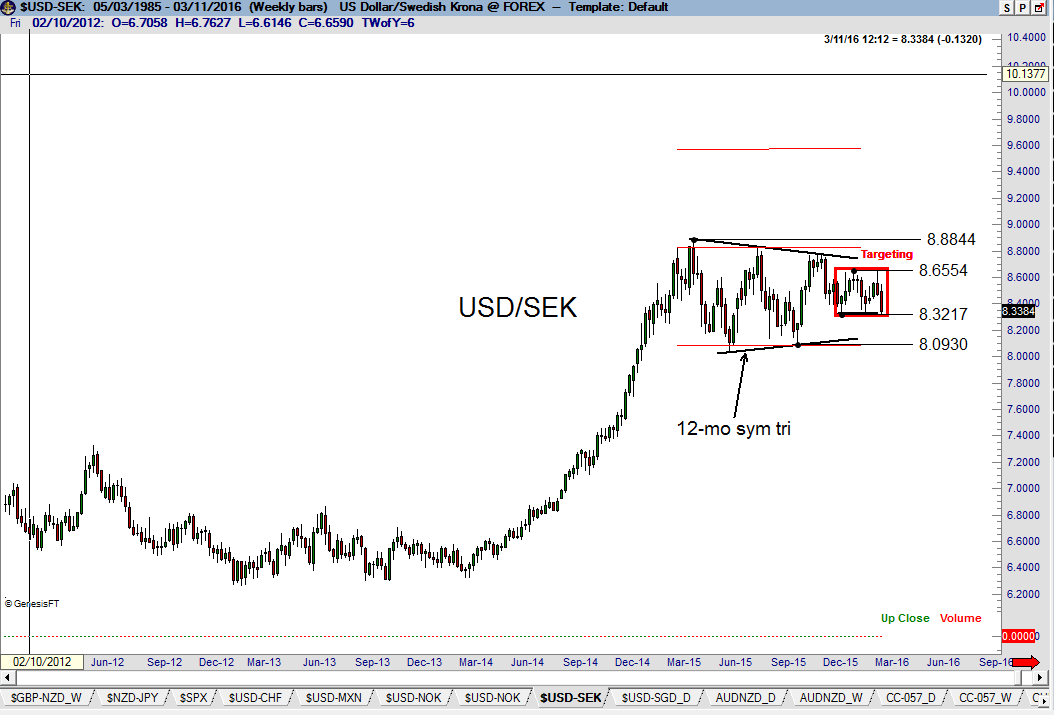
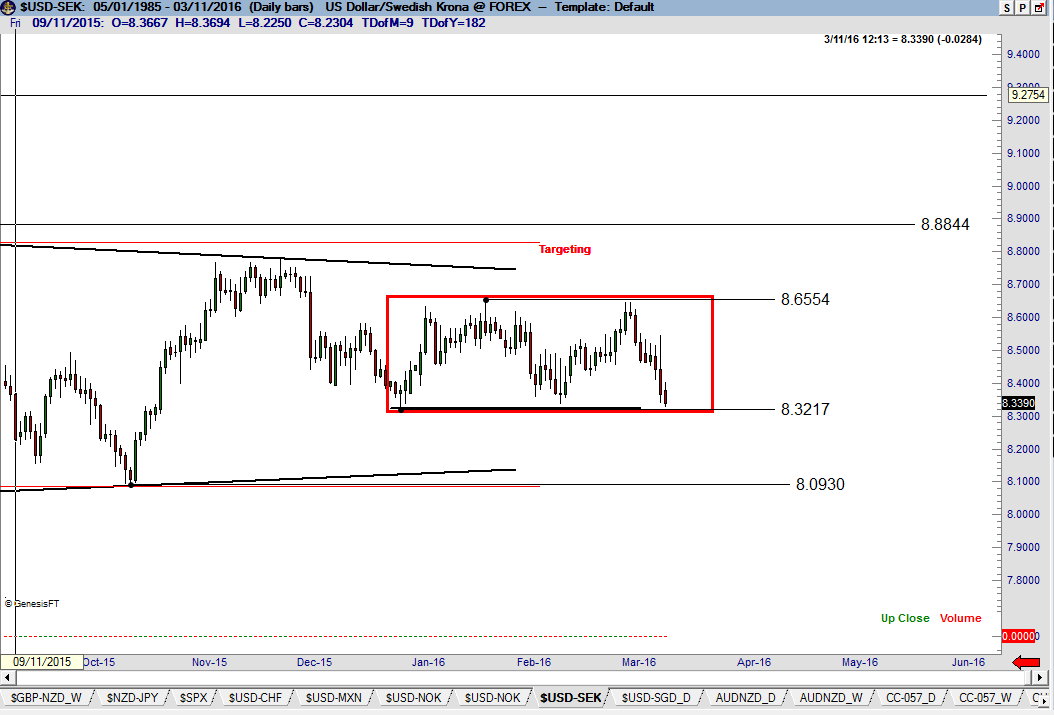
USD/SEK (weekly and daily charts)
The dominant technical condition in this forex pair continues to be the ongoing construction of a 12-month symmetrical triangle on the weekly graph. My bias has been that this pattern would be resolved on the upside, but the developments in the DX and USD/NOK provide a different perspective. Key to this pattern might be the 3-month rectangle currently under development on the daily graph. I may consider a small short “anticipatory” position in this cross on a close below 8.3100.
Leverage factors of the markets cited in this week’s Factor Update
Forex and futures markets are new to many Factor members. The table below is intended to help you understand the value of price moves for the markets mentioned in this week’s Update.
| Market | Position size | Value of price moves |
| Copper | One contract | Move from $2.25 to $2.26 per pound = $259 |
| Gold* | One contract | Move from $1250 to $1260 per oz. = $1,000 |
| AUD/NZD | 100,000 AUD | Move from 1.100 to 1.110 = $675 |
| USD/NOK | 100,000 USD | Move from 8.5000 to 8.4000 = $1,190 approx |
| Yen futures* | One contract | Move from 8.7 cents to 8.8 cents = $1,250 |
| Canadian $ futures | One contract | Move from 75 to 76 cents = $1,000 |
| Eurocurrency futures* | One contract | Move from $1.120 to $1.130 = $1,250 |
| Heating Oil | One contract | Move from $1.21 to $1.22 = $420 |
| New Zealand $ futures | One contract | Move from 67 cents to 68 cents = $1,000 |
| Soybean Oil | One contract | Move from 32 to 33 cents = $600 |
| Soybeans* | One contract | Move from $8.90 to $9.00 = $500 |
| S&P futures | One contract | Move from 2000 to 2010 = $500 |
| EuroStoxx futures | One contract | Move from 30000 to 3100 = 1,000€ |
| USD/SEK | 100,000 USD | Move from 8.3000 = 3.2000 = $1,200 approx |
| *Viable partial-sized mini contracts are available | ||
Anatomy of a trade – AUD/NZD
I have no pretense that my trading tactics are superior to others or that they should be emulated. All I know is that they fit my personality and style of trading. Yet, you might gain some insight from an explanation of my trading tactics. I will use as an example my current long position in AUD/NZD.
My focus for some time in AUD/NZD was the 19-week symmetrical triangle. The pattern, in my opinion, warranted a risk of 80 BPs – or in the parlance of my tactics, a three layer trade. On Mar 7 the market completed a bull flag and I bought 80,000 AUDNZD (per $100k of trading capital) at 1.0963 (red dot) with a protective stop at 1.0879 (below the Mar 7 low). This represented a 51 BP risk.
The way I view symmetrical triangles, the Jan high at 1.0973 needed to be violated to confirm the pattern. The cross closed at 1.0974 on Mar 7. I bought an additional 40,000 AUDNZD at 1.0980 on the Mar 8 open (green dot), using the same 1.0879 protective stop. This brought my total risk to 78 BPs. I have moved my stop on 60,000 AUDNZD to 1.1049. This was level from which the market went vertical on Mar 9. The stop on the remaining 60,000 has been moved to 1.0948, just below the Mar 8 low. I plan to take profits on 50% of my position around 1.1350. I am anxious to quickly advance my stop on at least one layer, but will take my clues from the market. I will monitor H&S bottom on the weekly graph as a separate trade.
plb
###


