Tag Archive for: AAPL

Apple (AAPL) — Head and Shoulders History

Apple has a long history of forming the Head and Shoulders chart pattern.

The monthly chart below shows the historical timing of the H&S patterns (yellow boxes).

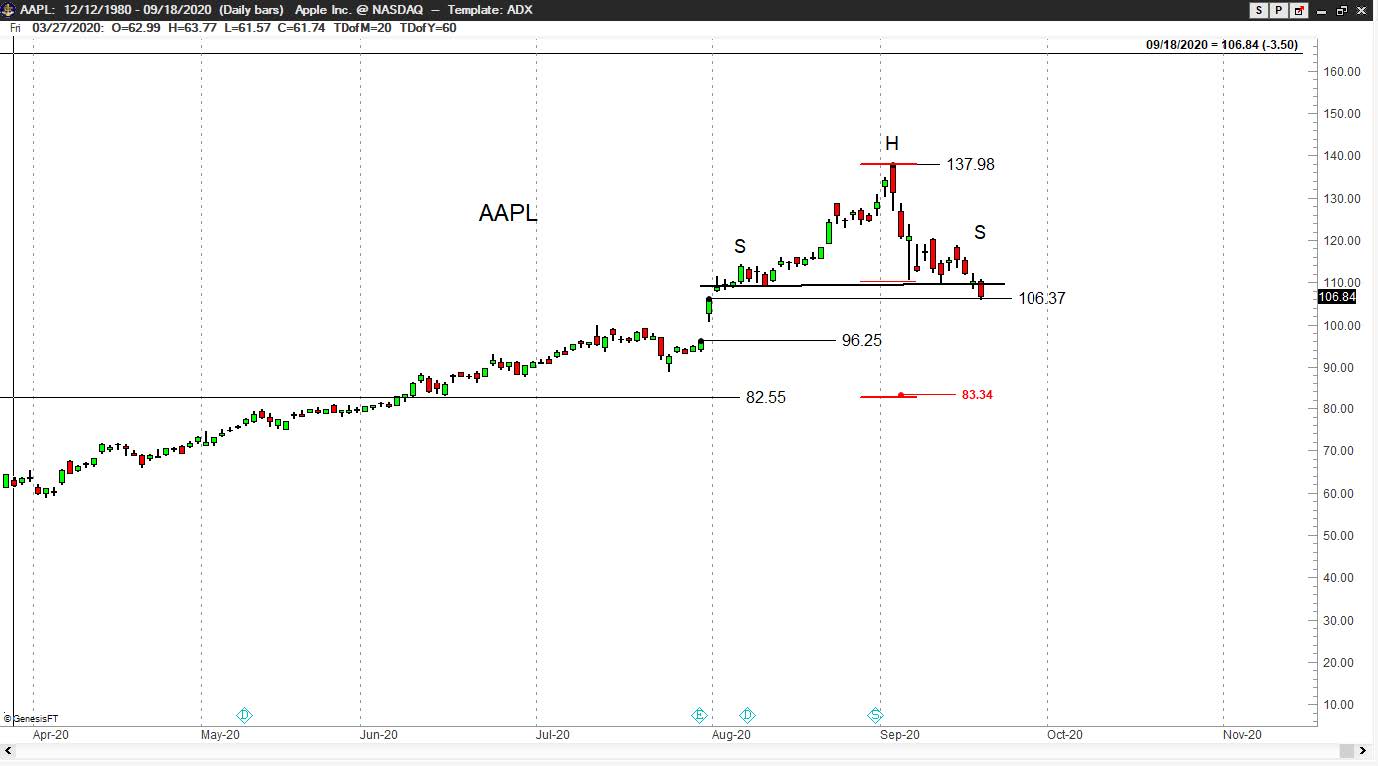
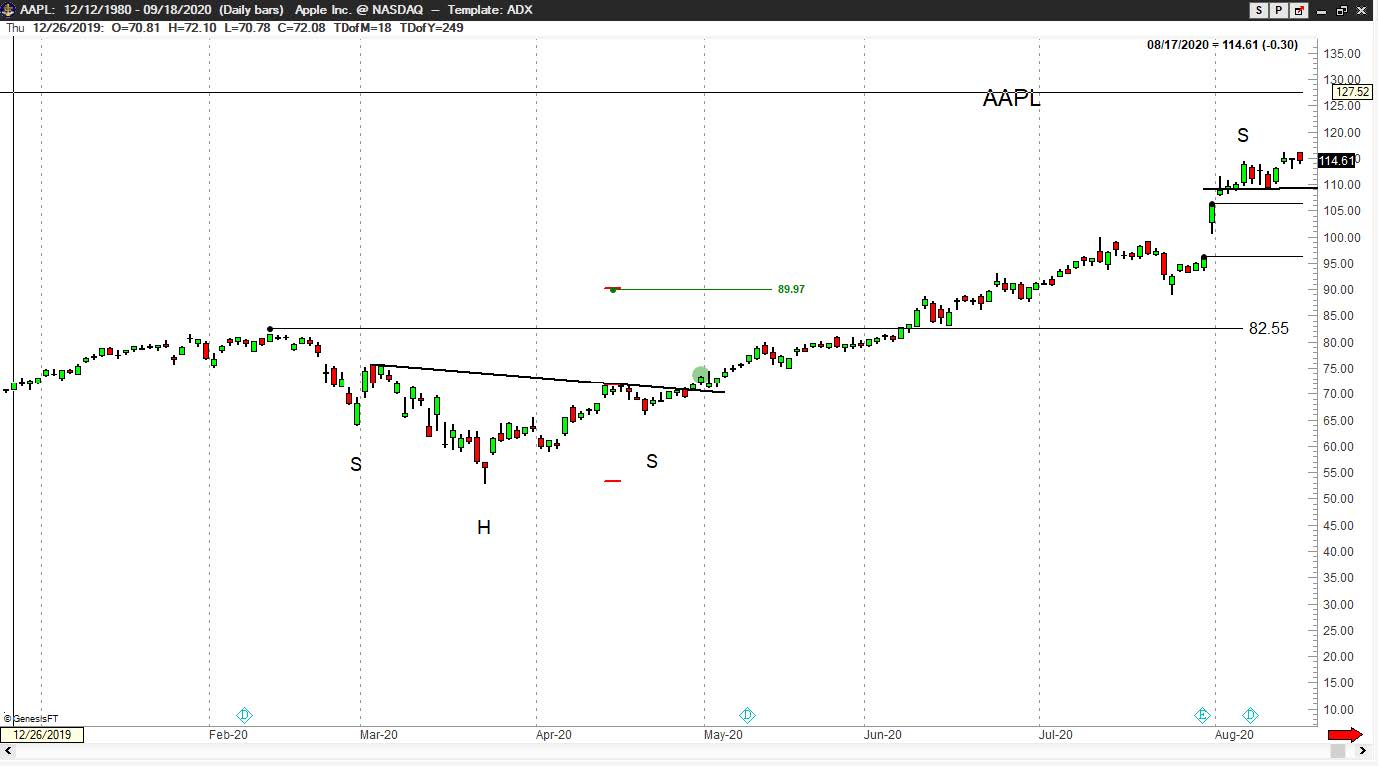
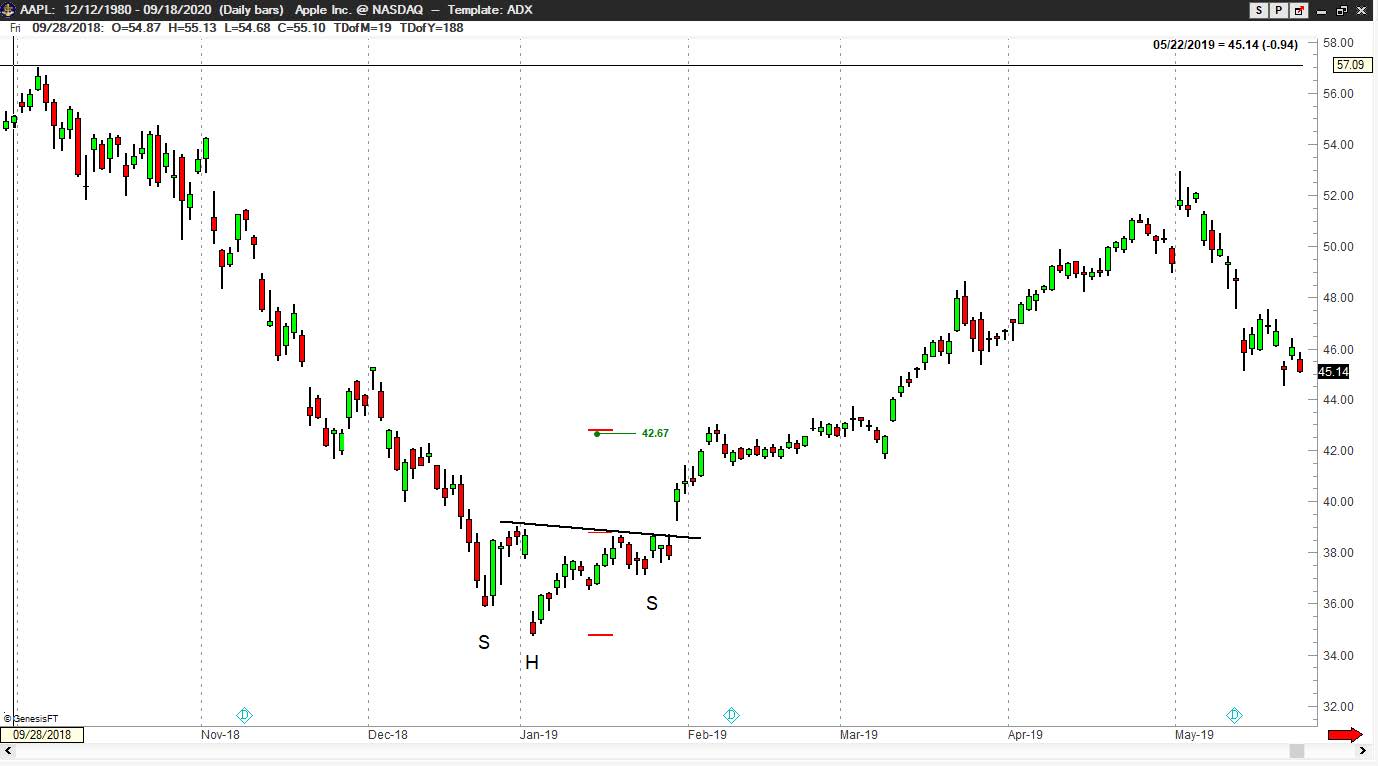
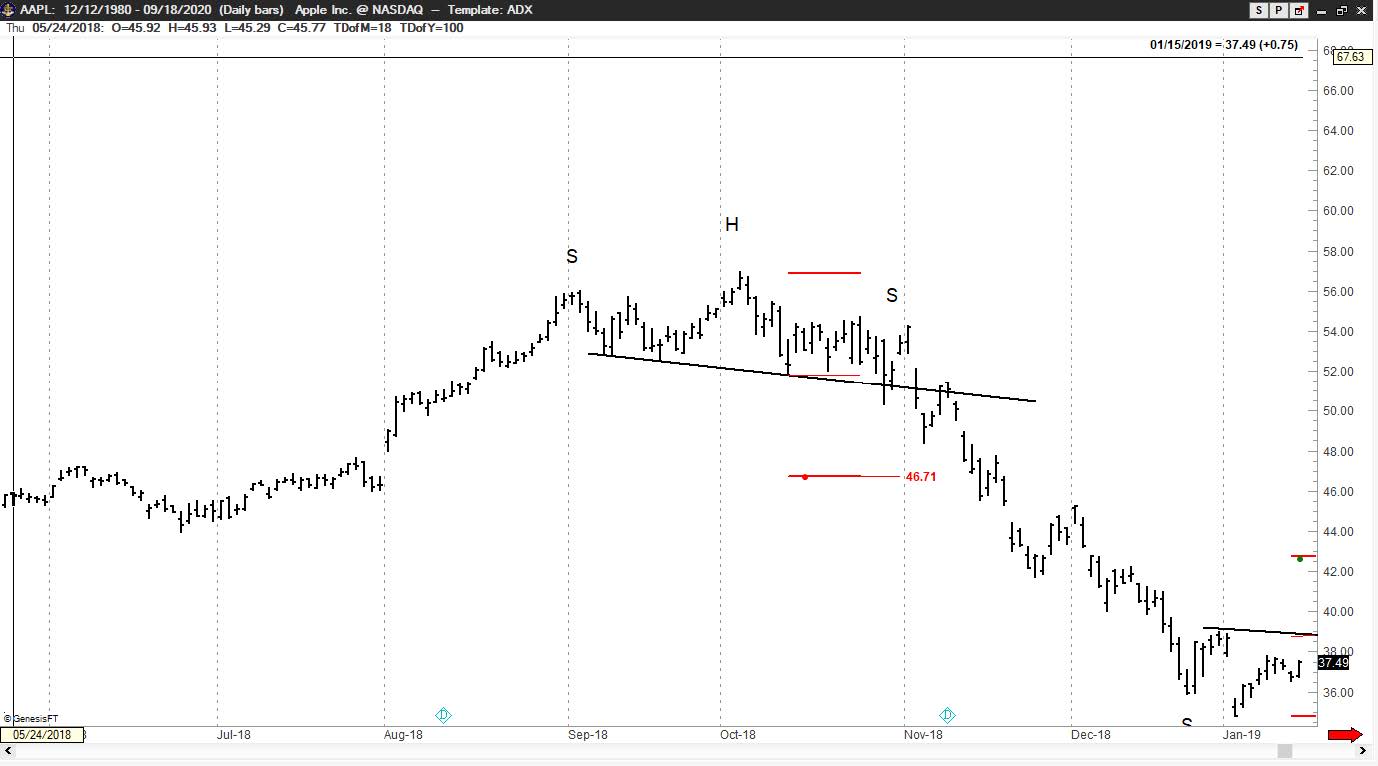
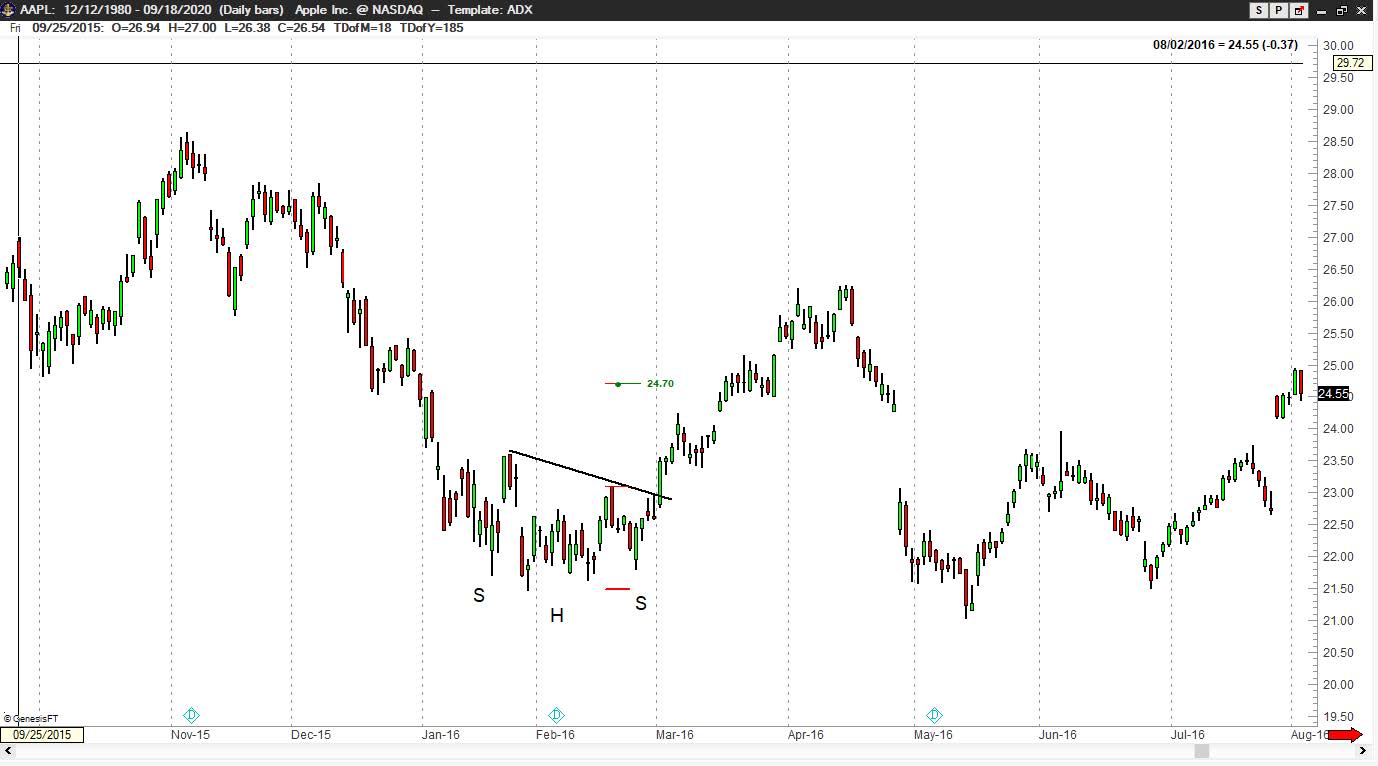
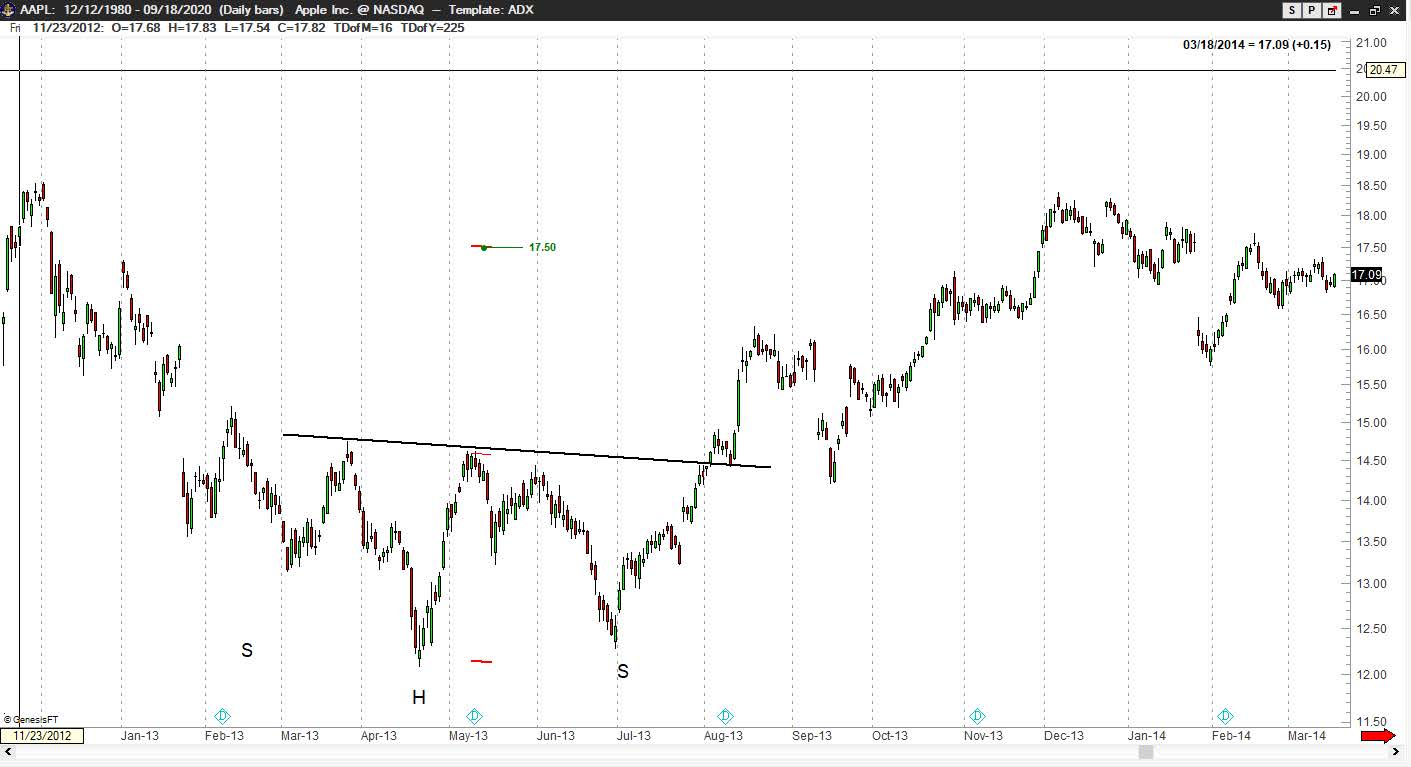
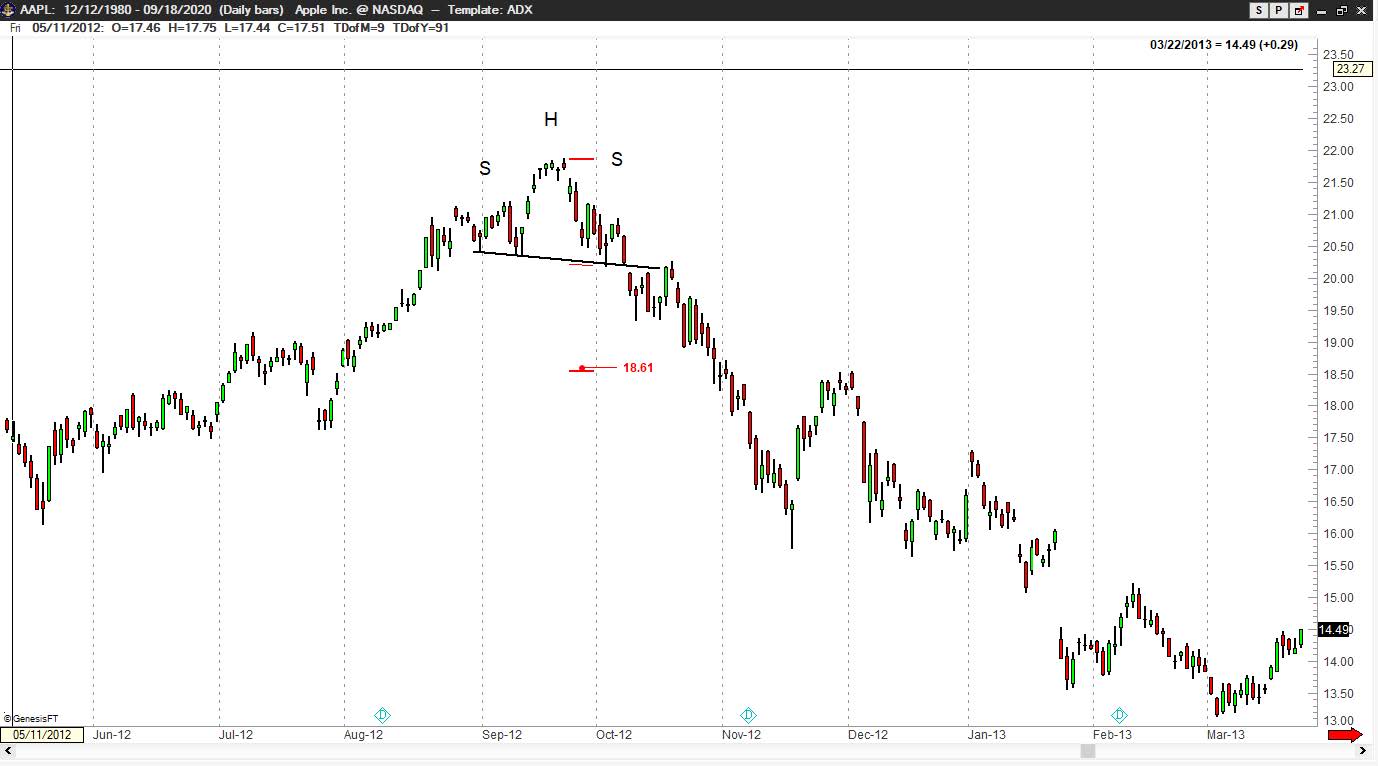
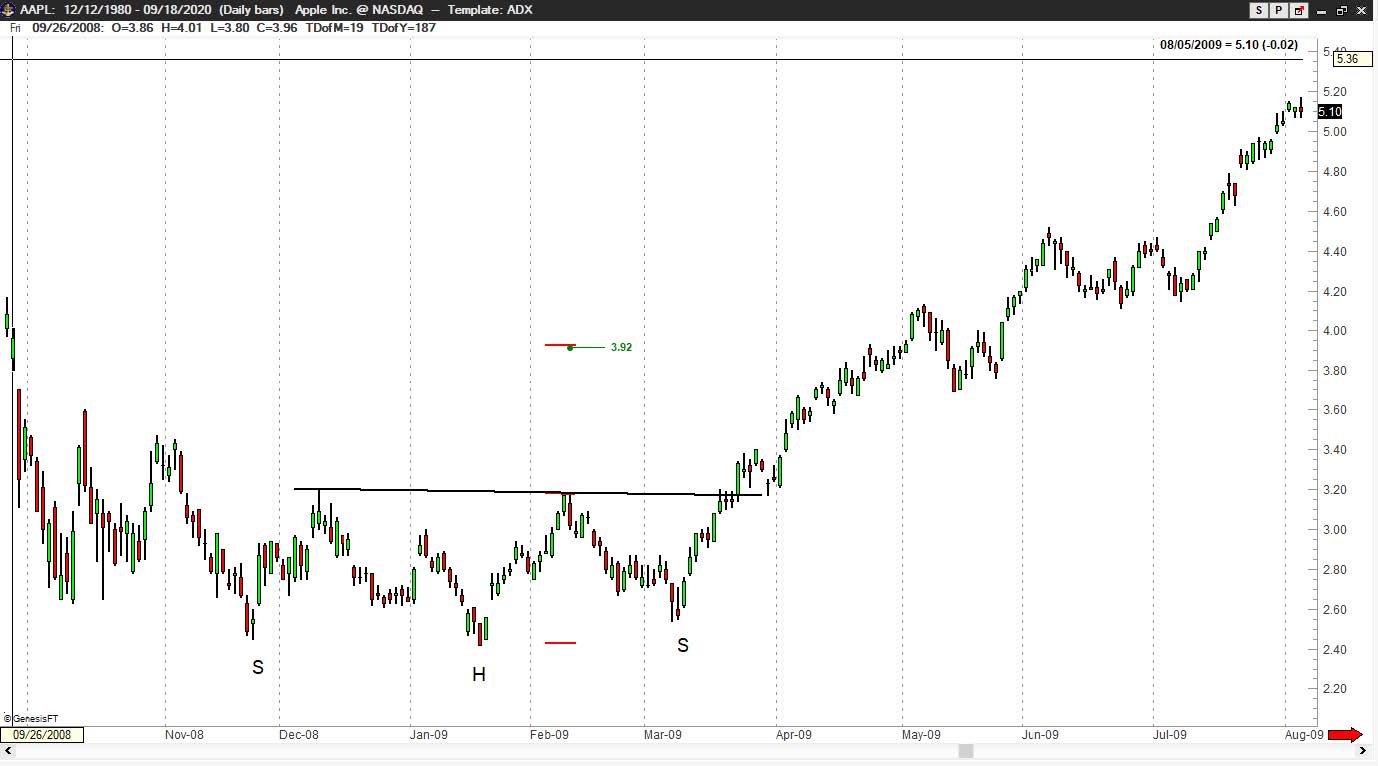
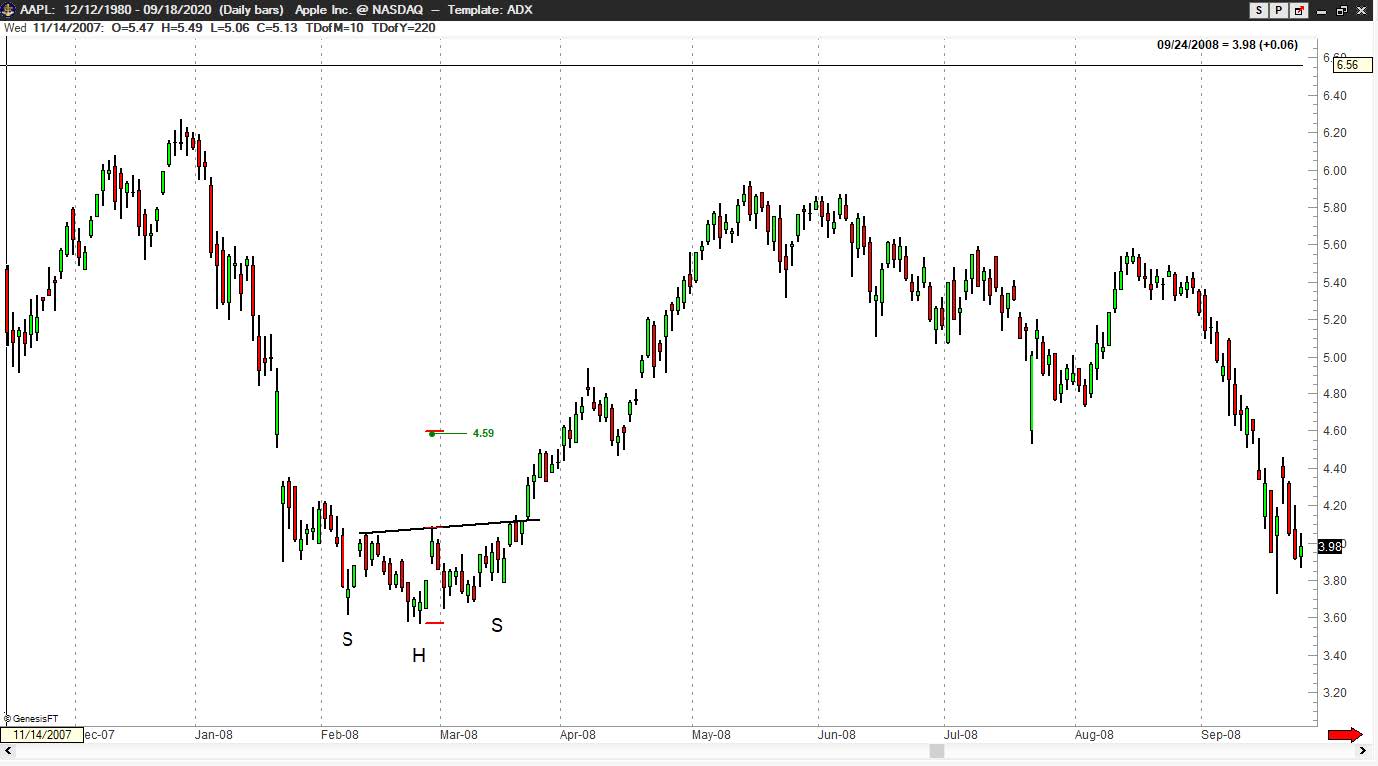
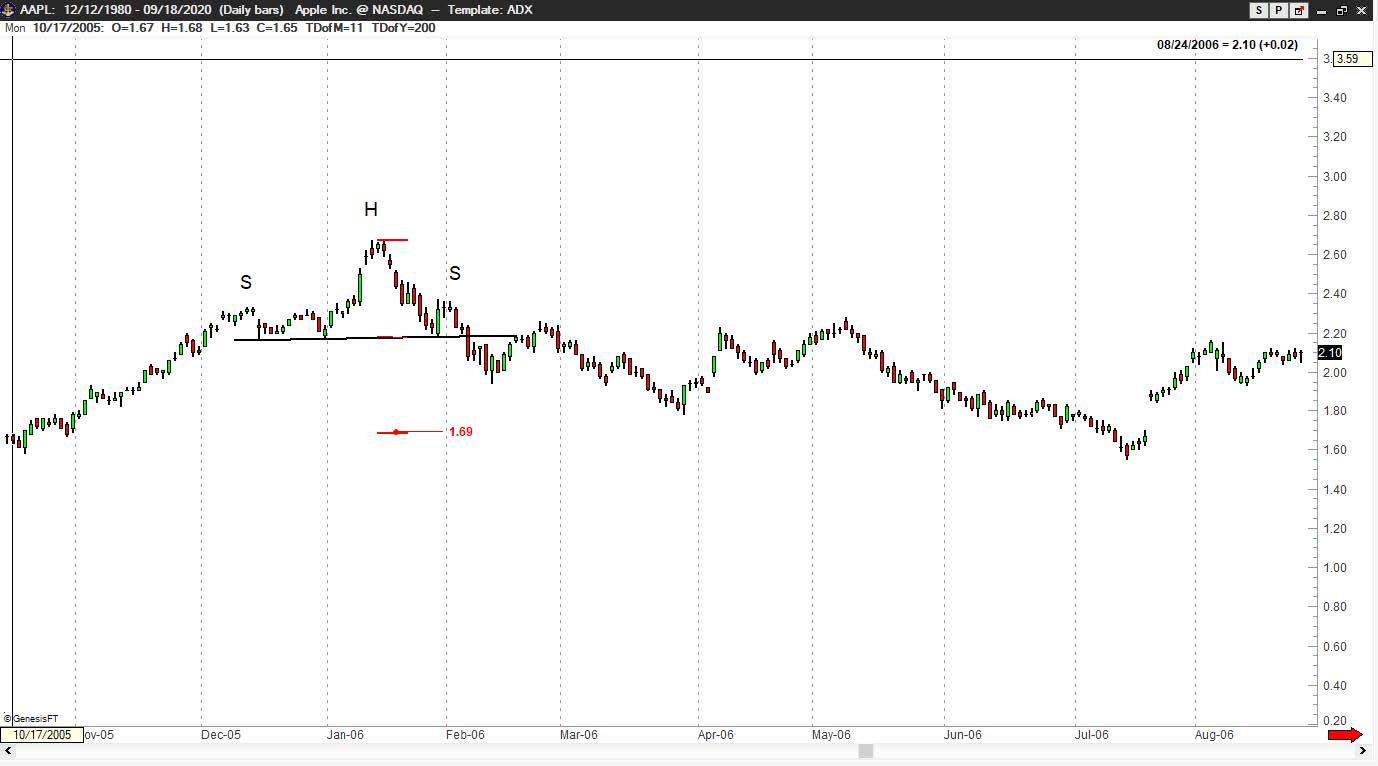
The daily charts of each H&S pattern indicate the price targets, including the H&S top just completed on Sep 18, 2020. In most cases price far exceeded the chart target.

The point is this – pay attention when a H&S pattern is completed in AAPL.

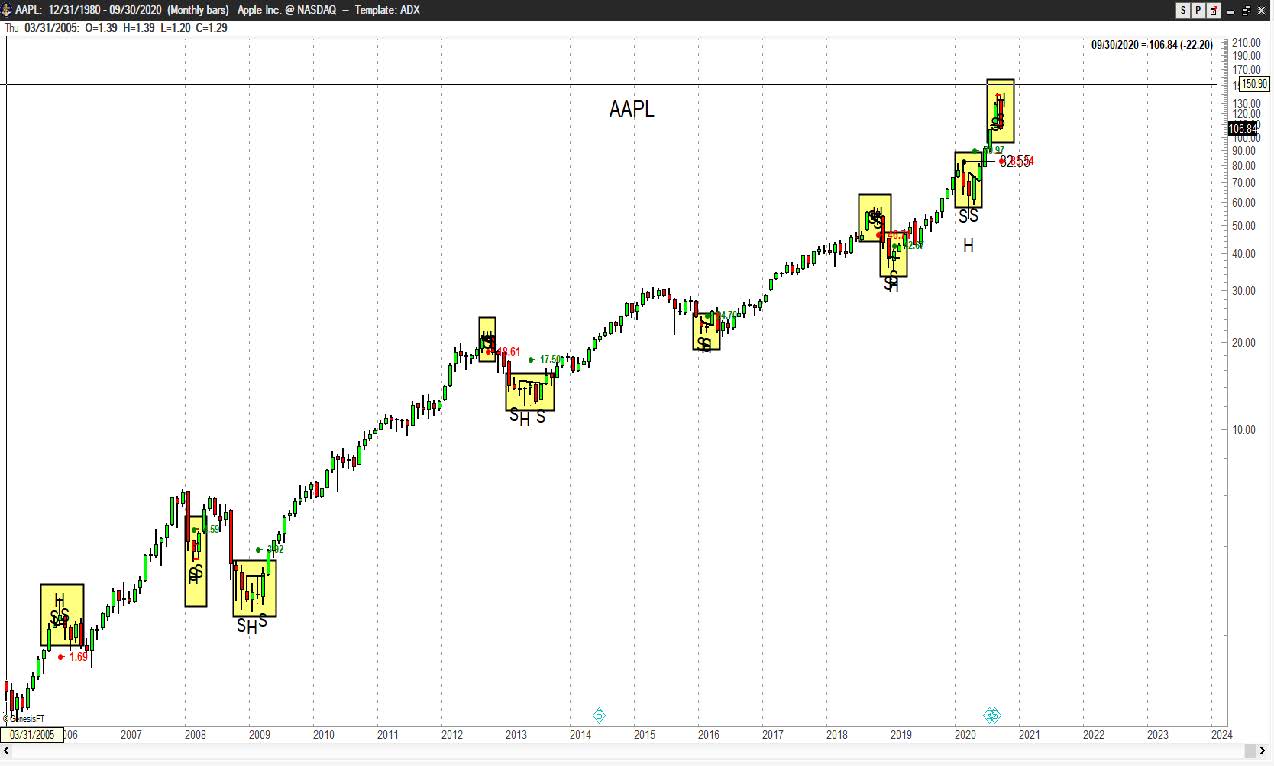
Completed Sep 18, 2020

Completed Apr 30, 2020

Completed Jan 30, 2019

Nov 2, 2018

Completed Mar 1, 2016

Completed Aug 5, 2013

Completed Oct 12, 2012

Completed Mar 23, 2009

Completed Mar 24, 2008

Feb 6, 2006

plb

The Pareto Principle in Action, Factor Report Commentary, June 7, 2020

This content is for members only

Factor Update, April 11, 2020

This content is for members only

Factor Update, December 7, 2019

This content is for members only

Factor Update, November 22, 2019

This content is for members only

Factor Update, November 16, 2019

This content is for members only

Factor Update, November 8, 2019

This content is for members only

Stocks Keep On

(This is an excerpt from the past weekend premium member report published last Friday morning the 1st)

S&P 500 (CME)

The S&P Index is attempting to penetrate the neckline of a 22-month continuation inverted H&S pattern. Note that a 15-week ascending triangle has been completed on the daily chart of the Dec contract. Perhaps this triangle will serve as the launching pad to complete the larger H&S configuration. Factor is long. Read More

Factor Update, November 2, 2019

This content is for members only

Factor Update, October 26, 2019

This content is for members only