Gap down in energy prices reminds me of my WORST trade ever
This content is for members only

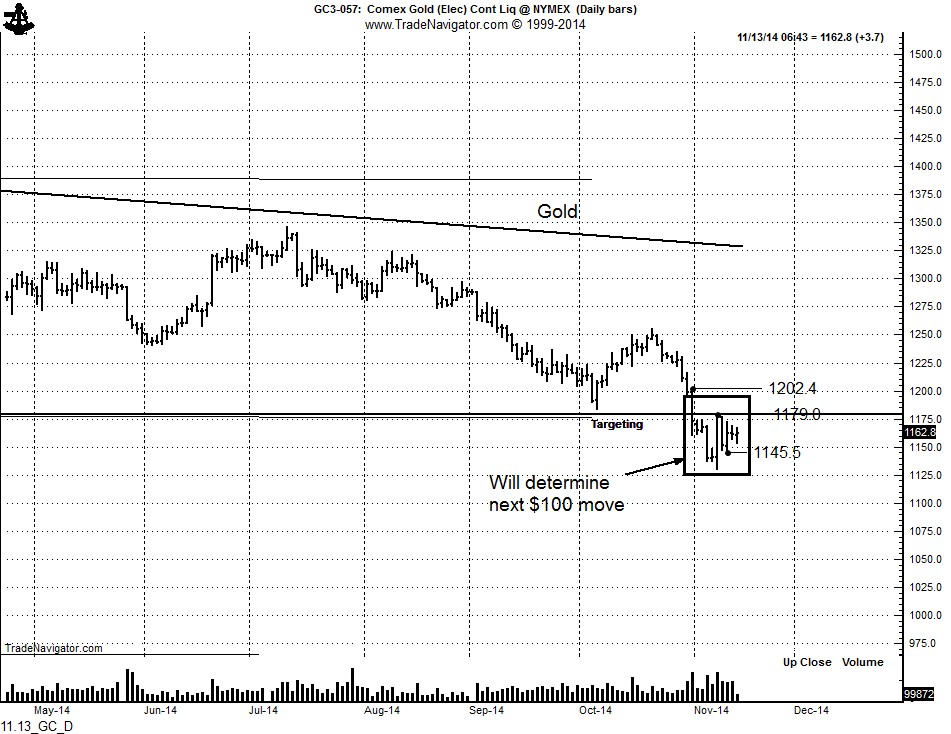
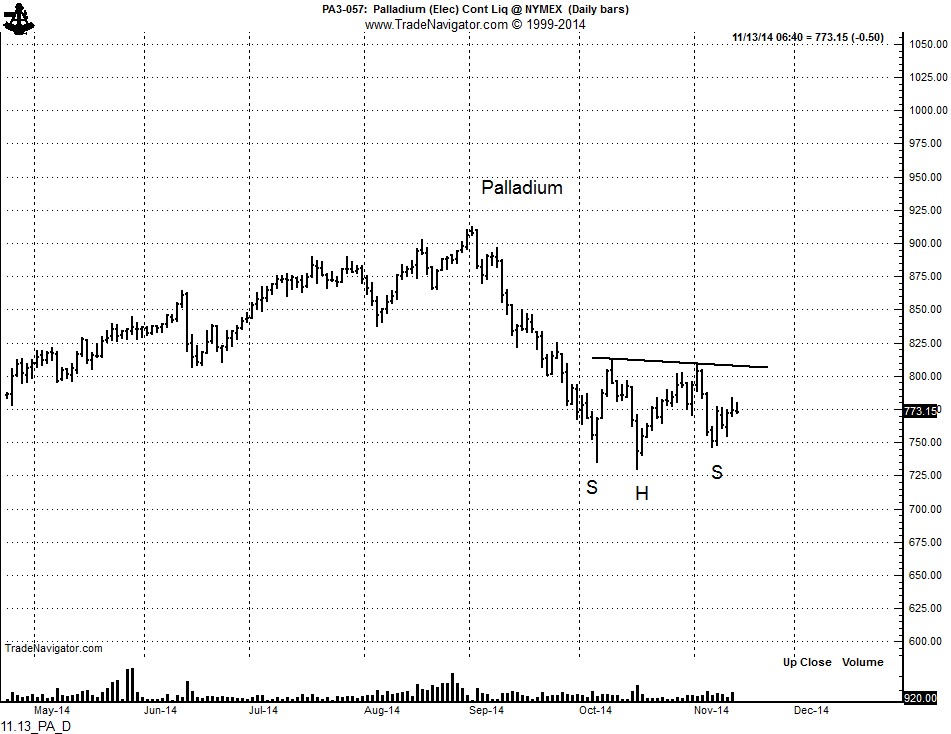
Keep your eyes on the precious metals. Gold and Palladium could be bottoming. A decisive close by Gold above 1180 and then above 1202 would be strong indications that the 3+ year bear market has run its course.
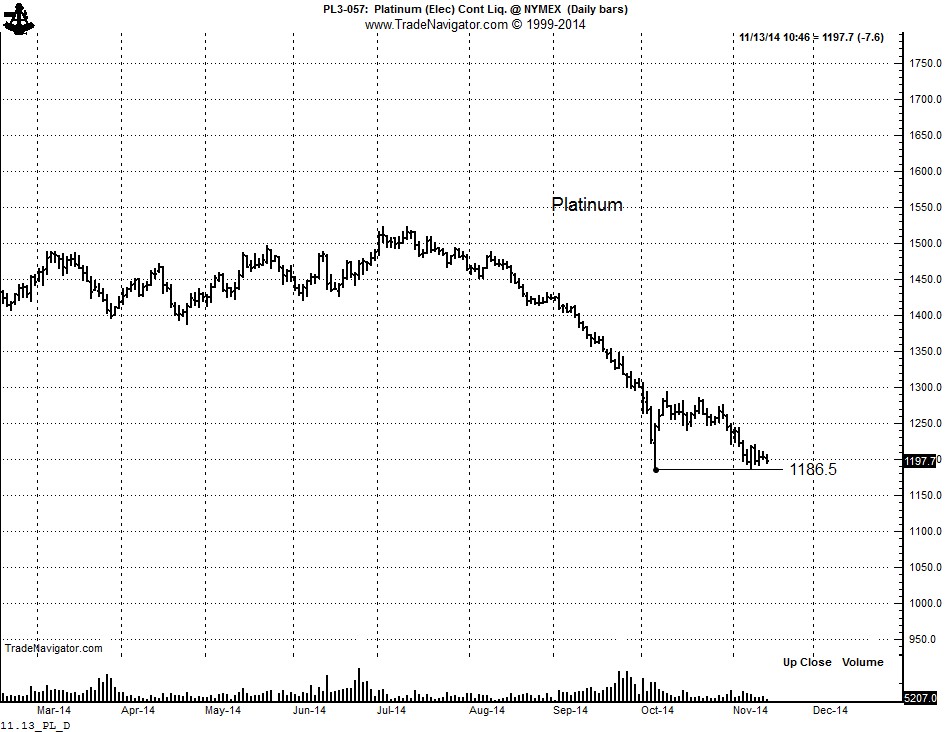
Palladium is forming a 9-week H&S bottom pattern. The key levels to watch for the next direction are the Nov high at 809 and the Nov low at 746.25. More bearish is the Platinum chart. A new low under 1186 would not be constructive.
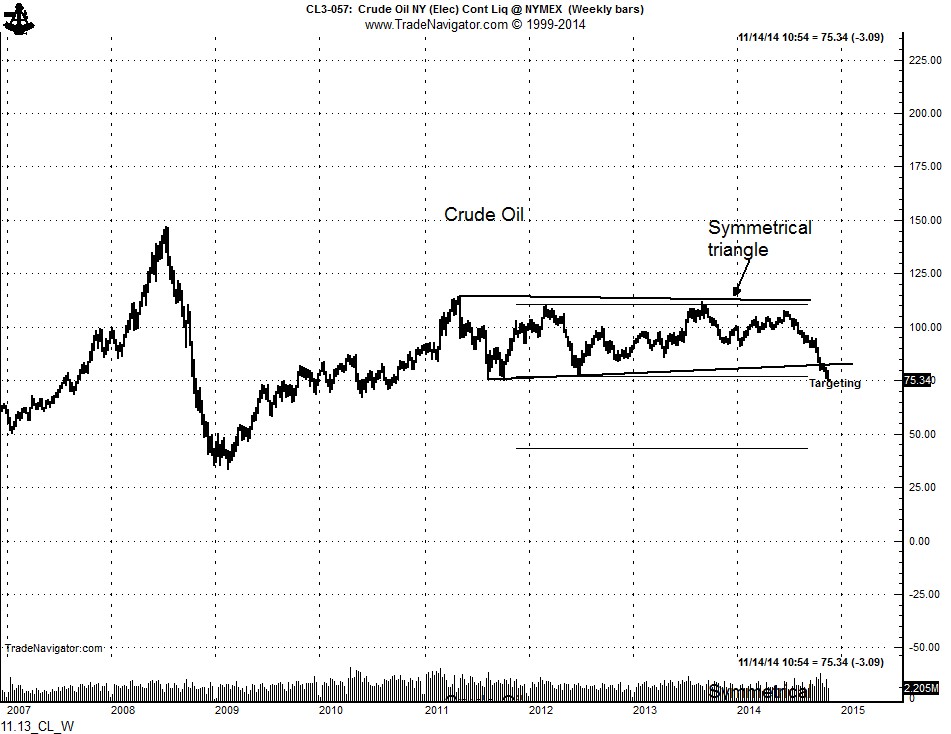
The weekly Crude Oil chart explains the current weakness. The 3-1/2 symmetrical triangle on the weekly chart has a target of $50. Look for real estate deals in North Dakota.
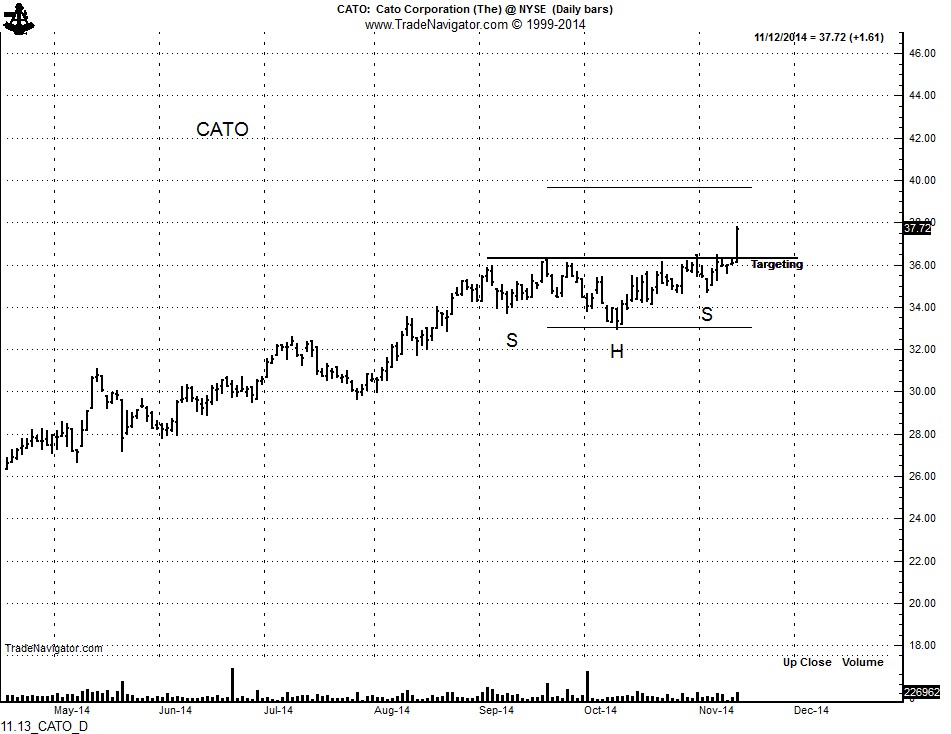
Kuddos to Factor member Paul S. for alerting me to CATO. On Tuesday he correctly interpreted the continuation H&S pattern in this stock and is profiting accordingly. Way to go, Paul.
###
It has come to be known as the “risk-on/risk-off” or “all-one-market” phenomena in global markets. It is a situation where seemingly unrelated markets have taken on an historically high correlation. Individual markets seem to be the proxy for all other markets.
I have witnessed periods in the past when unusually strong correlations existed for months and months. But, I have never experienced the level of correlation we have lived with as traders since 2008. There are a lot of theories out there to explain this phenomena. Most of them touch on the global flow of capital, speculative herd instincts, liquidity, the search for “safe havens,” and the like. I will leave the precise and correct explanation to those much smarter than myself.
Any way, I have come across near identical chart patterns in three seemingly unrelated markets (although I am sure I will hear a scenario from many of you as to why these markets are not unrelated).
The charts shown below are Crude Oil, S&Ps and the EURUSD. Note that the first two are daily graphs, while EURUSD is an intra-day chart. Seeing the same pattern in different time frames has become known as the “fractal” concept. But, nevertheless, the price behavior of the three markets has been nearly identical during their respective corrective rallies.


Will the outcomes be the same? Will one of the three be the leading indicator? It will be interesting to see. I can say this — the pattern is either very bearish or quite bullish. Talk about hedging my bet? What we see at the present time qualifies as a possible bearish rising wedge of a possible horn or sloping bottom.
My guess is that all three patterns will morph into something different. Big help am I!
Markets: $CL_F, $OIL, $SPY, $ES_F, $EURUSD, $G6E_F
![]()
