Tweet Storm
While on Twitter last night, I engaged followers in an unscripted Q&A session. The exercise was quite enjoyable in fact and we thought we would share the experience on the website today. Here is a transcript of that Tweet Storm for you.
The secret of compounding and patience. Trading is a marathon, not a sprint
— Peter Brandt (@PeterLBrandt) November 28, 2017
Yes. I like to hold half of my position (or hodl in the case of $BTC) and trade half.
— Peter Brandt (@PeterLBrandt) November 28, 2017
Run like hell
— Peter Brandt (@PeterLBrandt) November 28, 2017
5 to 8 trade per month (I trade 50 mkts over course of a year). Correct on annual ROR. I limit risk to 1% of capital max per trade. Trade size based on this.
— Peter Brandt (@PeterLBrandt) November 28, 2017
Schabacker. Of course I love patterns so I am biased.
— Peter Brandt (@PeterLBrandt) November 28, 2017
In 2016 and 2017 it has been $BTC. I've made the most $$ in stock index futures.
— Peter Brandt (@PeterLBrandt) November 28, 2017
I am accountable to my process. I differentiate between a "smart trade" and a profitable trade. I focus on the process
— Peter Brandt (@PeterLBrandt) November 28, 2017
Turn off your screens. My trade entry is limited to 30 minutes per day. I make every attempt to not pay attention to price action
— Peter Brandt (@PeterLBrandt) November 28, 2017
The best question of the night. Overcoming human emotions is the hardest part of trading. I manage emotions through trading rules that I require myself to follow
— Peter Brandt (@PeterLBrandt) November 28, 2017
Totally. Crypto traders have only know a bull trend. They are quick learners but they will need to learn a ton about markets that go both ways.
— Peter Brandt (@PeterLBrandt) November 28, 2017
I actually do not have my own book on my recommended list. Market Wizard series and the Schabacker book.
— Peter Brandt (@PeterLBrandt) November 28, 2017
Adopt a simple MA
— Peter Brandt (@PeterLBrandt) November 28, 2017
Very similar, but only interested in short side when mkt actually makes a turn.
— Peter Brandt (@PeterLBrandt) November 28, 2017
I do not think in those terms. I think in terms of do I want to be a chart reason to be short or long at any given time
— Peter Brandt (@PeterLBrandt) November 28, 2017
I would have loved to have known more about options. I am completely ignorant on them and at this point no desire to learn
— Peter Brandt (@PeterLBrandt) November 28, 2017
Not sure. Most crypto trades have no clue what the swap market is all about. Initially the futures market will act as a swap market.
— Peter Brandt (@PeterLBrandt) November 28, 2017
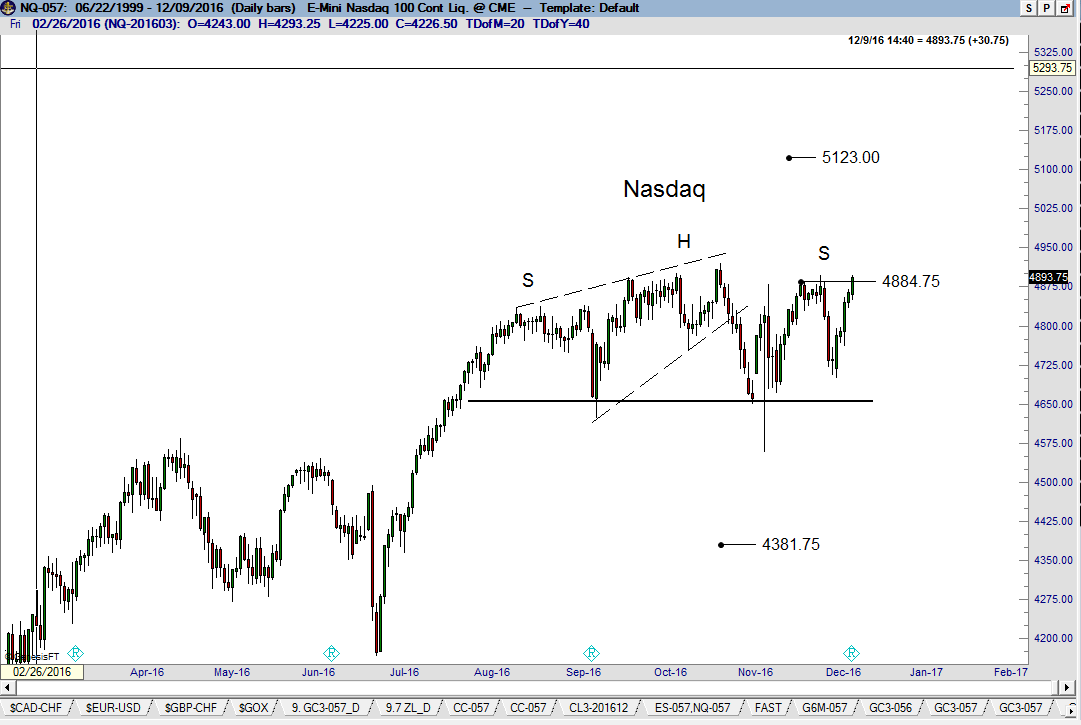
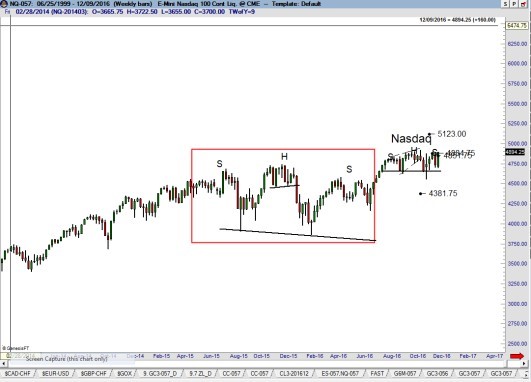
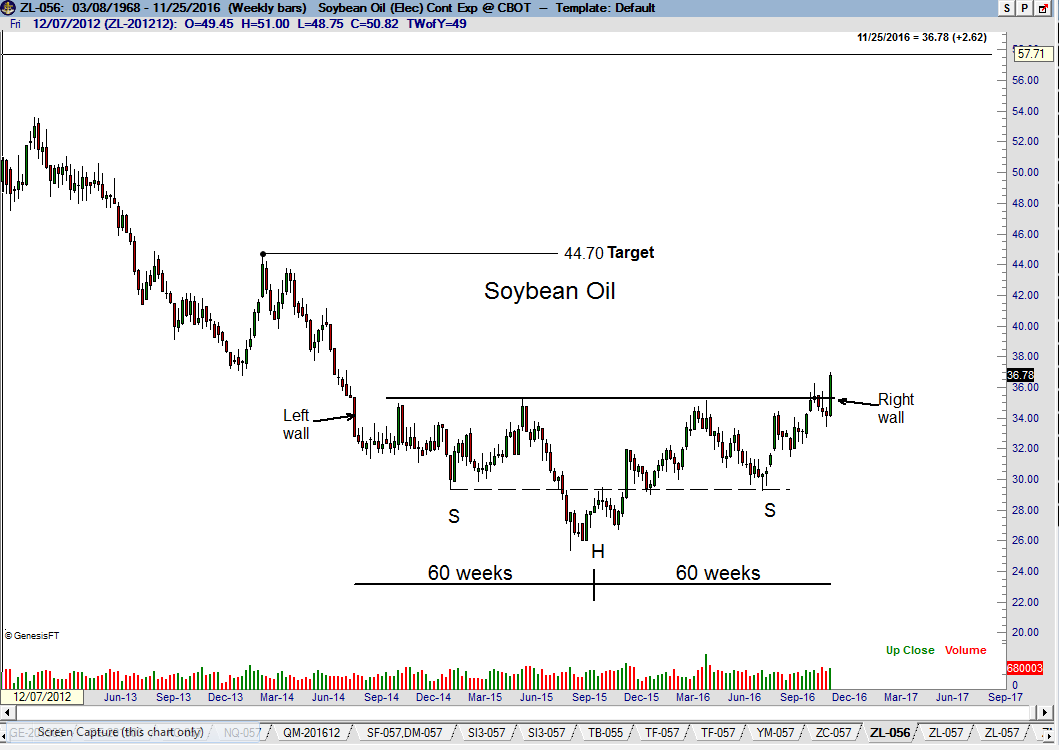
10 to 26 week horizontal pattern (as opposed to diagonal pattern). Launched by 4 to 8 week pattern. Trade in direction of near record commercial COT positioning. Trade strongest mkt in category.
— Peter Brandt (@PeterLBrandt) November 28, 2017
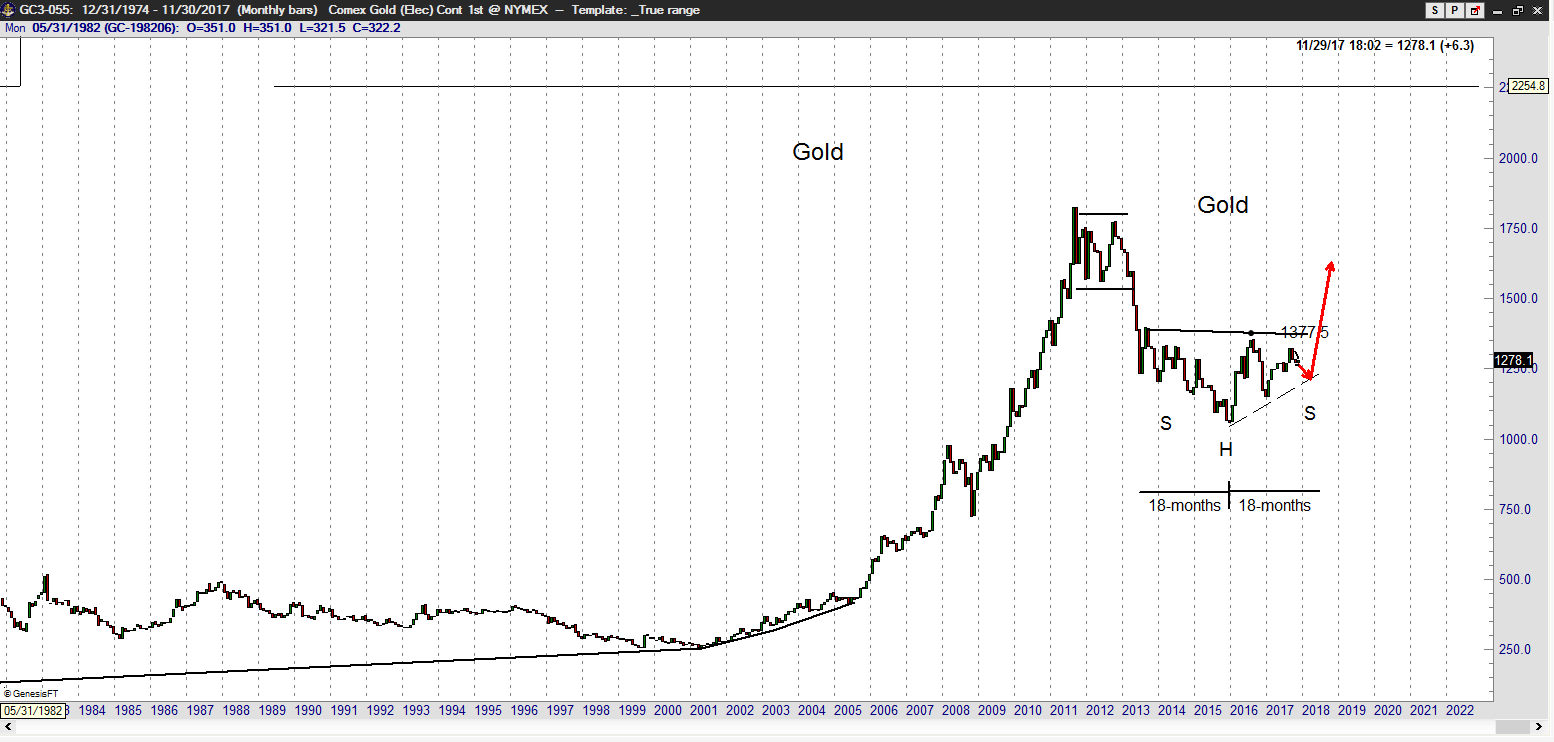
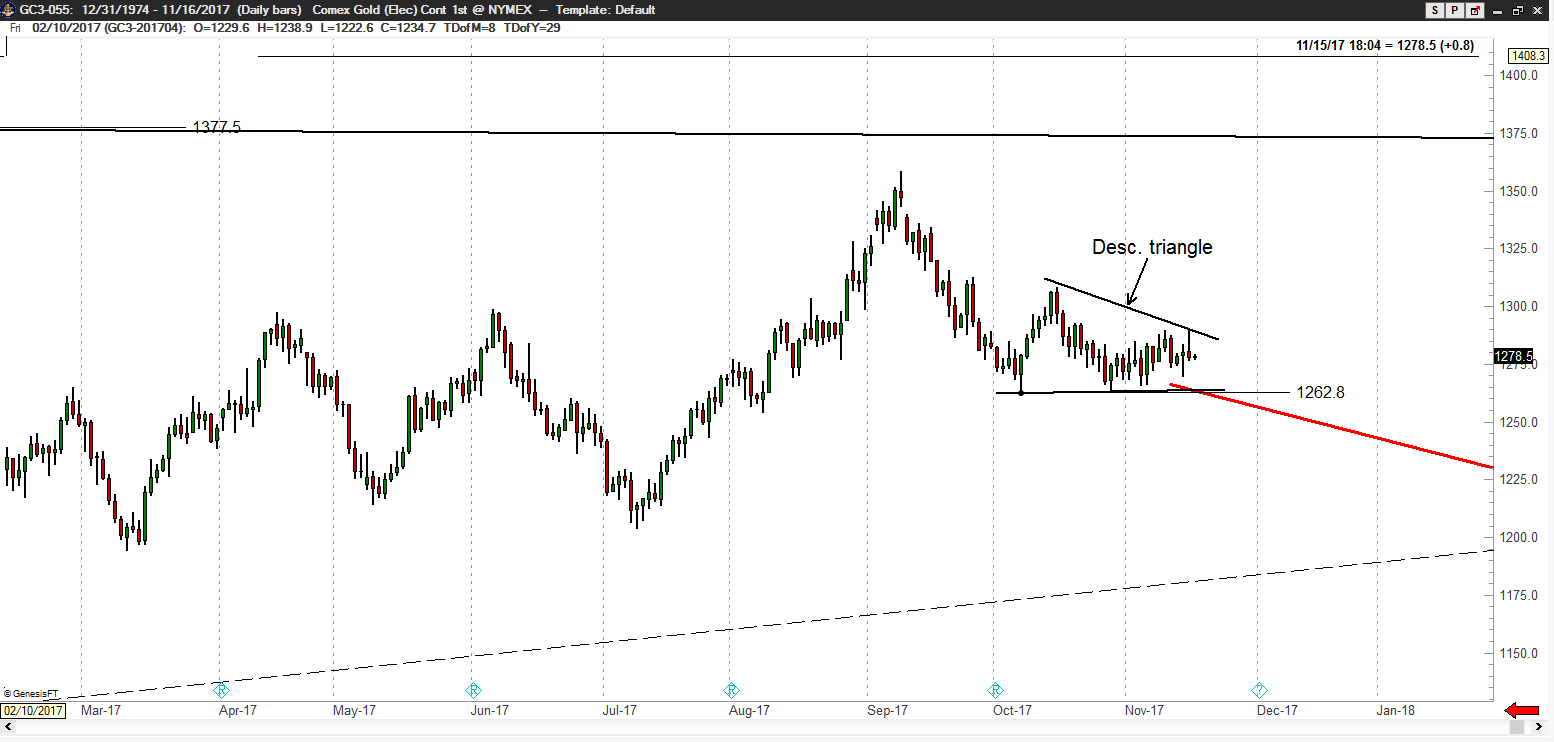
I am extremely constructive on Gold over the next 18 months, but want to be short in the near term (no current position)
— Peter Brandt (@PeterLBrandt) November 28, 2017
Canadian Dollar.
— Peter Brandt (@PeterLBrandt) November 28, 2017
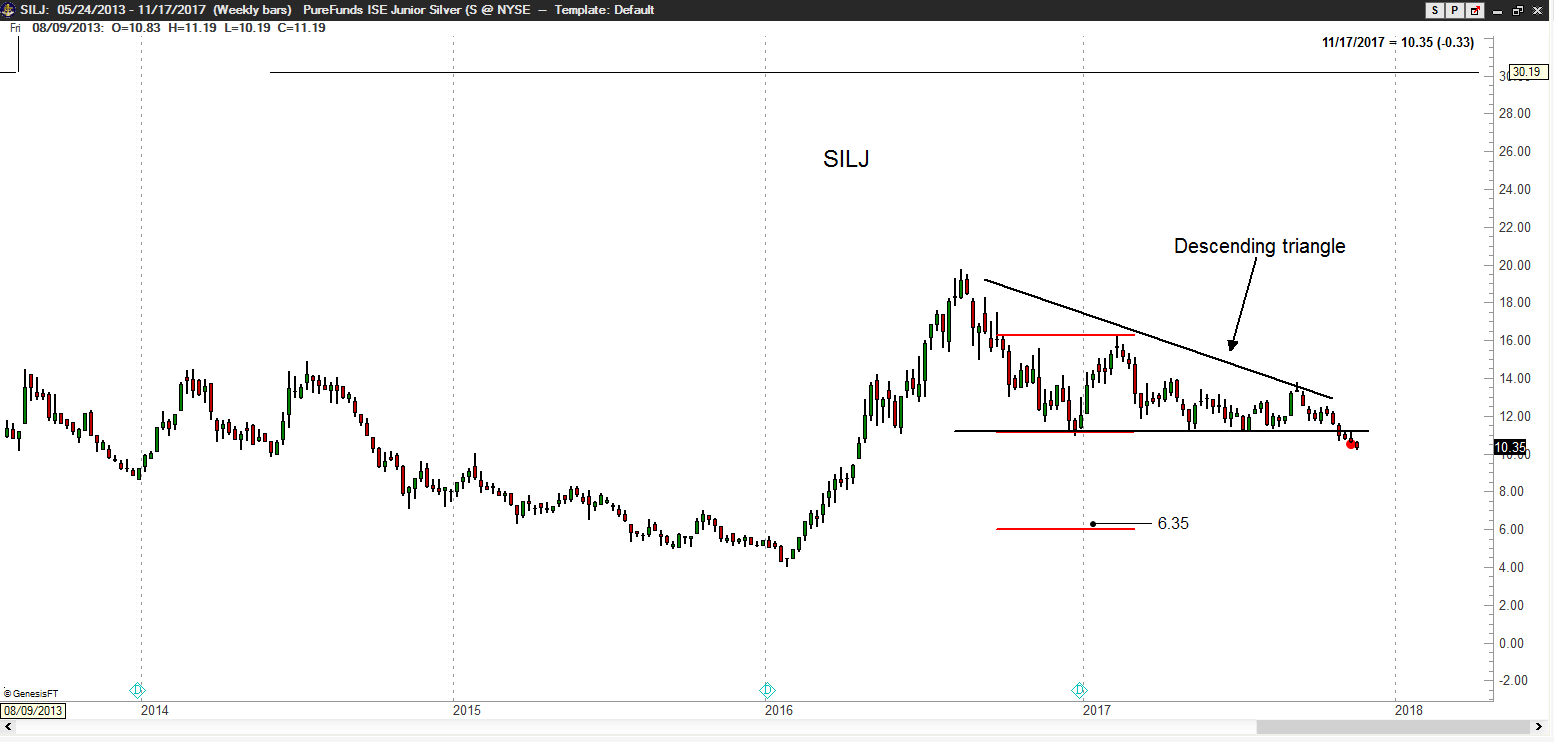
I am not a fan of the ETFs. They will far underperform in carrying charge markets.
— Peter Brandt (@PeterLBrandt) November 28, 2017
Actually quite similar, yes. Although time frames in cryptos has shrunk what we had in Silver and Gold
— Peter Brandt (@PeterLBrandt) November 28, 2017
Not smart enough to understand entire tether issue, but to me it seems like it is watering down main coins
— Peter Brandt (@PeterLBrandt) November 28, 2017
Definitely NOT the overbought/oversold RSI Stochastic types. Mkts can remain overbought for long time. Probably simple MAs and ADX — love when daily and weekly ADX goes below 12 at same time
— Peter Brandt (@PeterLBrandt) November 28, 2017
For a swing trader an 8 day MA will actually work
— Peter Brandt (@PeterLBrandt) November 28, 2017
Factor Membership
.
Peter Brandt is a 40+ year veteran of trading. Through his Factor Service, members receive:
.
View your Factor Member options here. You could consider your membership in the Factor Service as just one more trade. If the Factor Service is not of value to you, well, it is just one more trade that did not work. Through the Factor Service I endeavor to alert novice and aspiring traders to the many pitfalls you will face – and to offer advice on overcoming those pitfalls. My goal is to shoot straight on what trading is all about. For more information watch my 30 minute webinar where we cover the Factor service in depth.
I hope you will consider joining the Factor community.


.


 Question:Peter, could you condense as briefly as possible the approach you take to trading?