Chart of the Day — with a Hearty Hi-Ho Silver Away


Silver could be experiencing a serious technical breakdown


And with it, Silver bulls might experience a serious emotional breakdown


Whenever a market makes a new high or low for a move, a technical trader must ask him or her self the following question:

“Is this price movement a blow-off, to be followed by a reversal, or is this price movement a sign of another leg of the dominant trend?”

Let’s review the Silver charts.

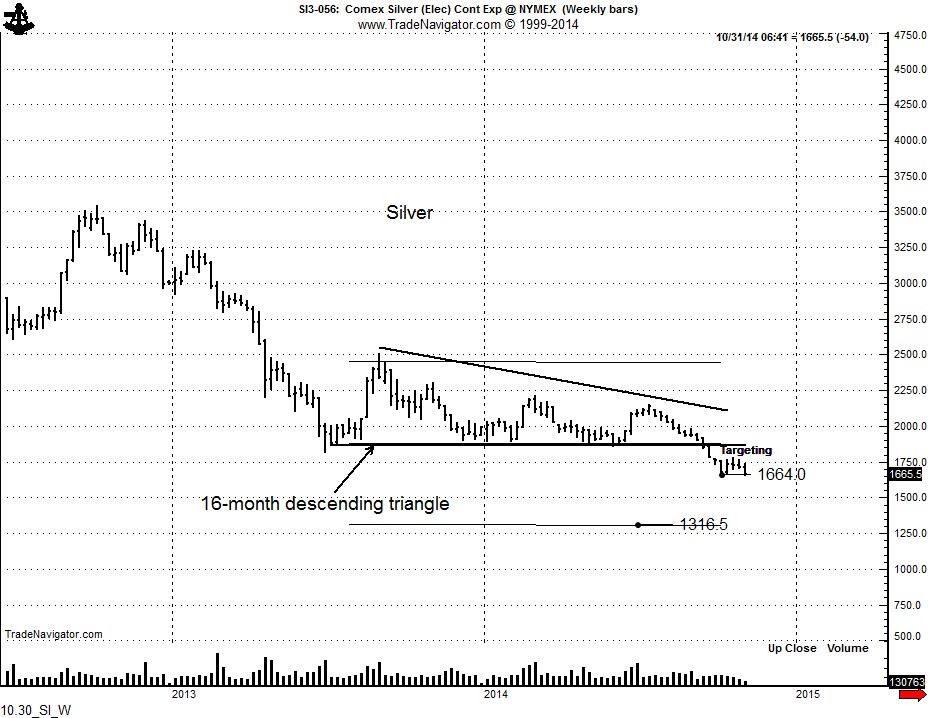
The decline in mid September completed a 16-month descending triangle pattern on the weekly chart. This pattern implied an eventual decline by Silver to 13.16 or so.

10.30_SI_W

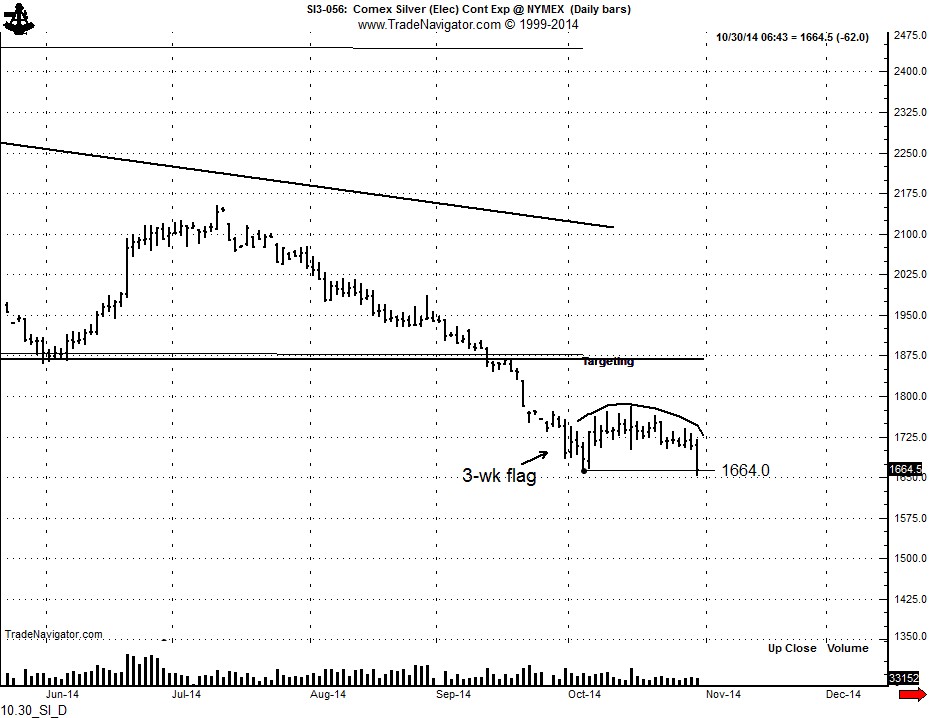
The market bottomed on October 3 and began a mild and dull 3-week rally that took the form of a small rounding pattern or flag on the daily graph. The strong decline today — IF IT FOLLOWS THROUGH — would be an indication that the market will trend steadily to the 13.16 target.

10.30_SI_D

Shorts must realize that a breach of the October 30 high, and even more so, the October high, would place the interpretation into doubt.


$SLV $SI_F


###


The Chart History of the Gold Market — an Updated Edition


Gold is the ultimate charting market. Gold rarely begins a major trend without first ringing a bell and waiving a flag announcing its intentions.

 A must read for all Gold bugs, merchants, producers and traders


For the Updated Edition, click here or on the page below.


10.14_History of Gold Charts


[scribd id=244253053 key=key-HHcGq4HDD7hrMvQoEXyY mode=scroll]


$GC_F, $GLD, #GOLD

Putting the current bear markets in Gold and Silver into a longer-term perspective


Silver bulls may eventually be right, but they are still idiots.


By contrast, Gold bulls represent — by and large — a thoughtful group of folks.

As a trader and blogger, I love to have fun at the expense of Silver bulls. No other market I trade has a larger and more obsessed cult following of non-thinking and emotional “investors.”

I tend to be a Bayesian thinker. In my career as a trader dating back to 1976 I have found that most really good traders are Bayesian, whether they even know the term. No way could a logical Bayesian buy into the nonsense believed by Silver bulls. In mean, these are people who believe the Gold/Silver ratio should be 15 to 1 because it was so proclaimed by some Spanish king 500 years ago!

The daily and weekly graphs of Gold and Silver indicate that lower prices are most likely. Key chart levels are giving way, calling for a possible sharp drop from current prices. Let’s review these charts.

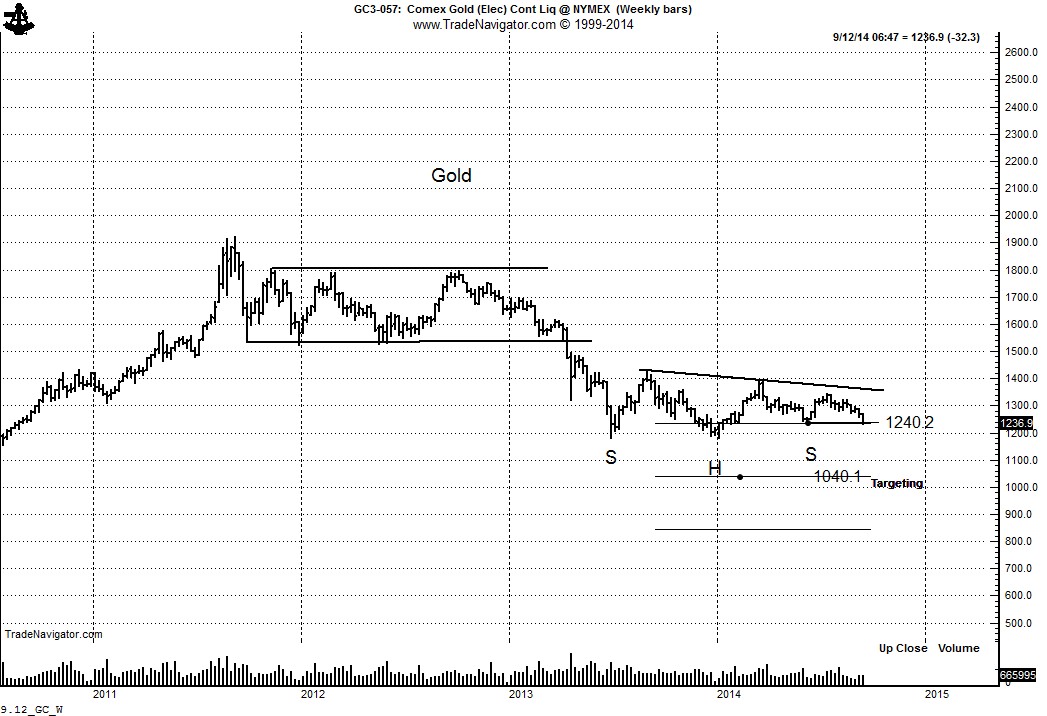
The weekly Gold chart is attempting to complete a 15+ month H&S failure pattern. A decisive close below 1240 will complete this chart configuration and indicate a possible target at low as 1040. HERESY! … the Gold bulls proclaim. It must be market manipulation — after all, the destiny for Gold is $5,000 per oz.
9.12_GC_W

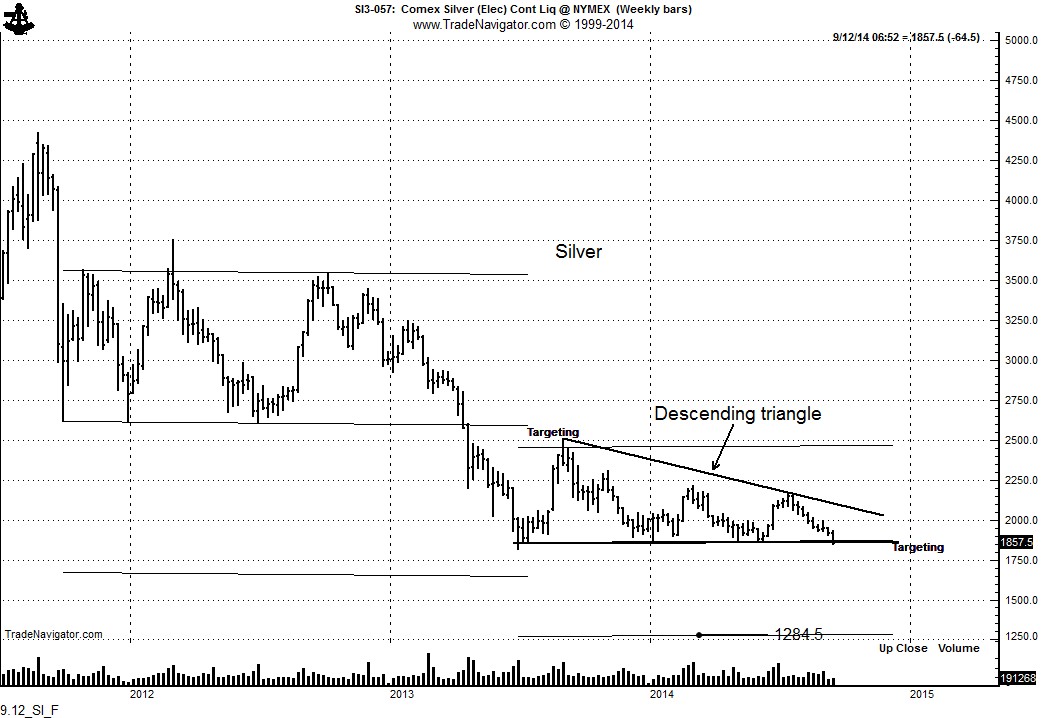
The weekly Silver chart is challenging the lower boundary of a descending triangle. A decisive completion of this pattern would indicate a target of 12.85. ABSOLUTE HERESY OF THE FIRST ORDER! THE GLOBE IS OFF ITS AXIS!!! This cannot happen. Impossible. After all, the cost of mining is $15 or $25 or whatever per oz. Let me say this once clearly for you Silver suckers — the cost of production means nothing. Who cares if small marginal cost-of-production miners shut down. It means nothing. It would take years and years of low prices for the big miners to shut down.
9.12_SI_F

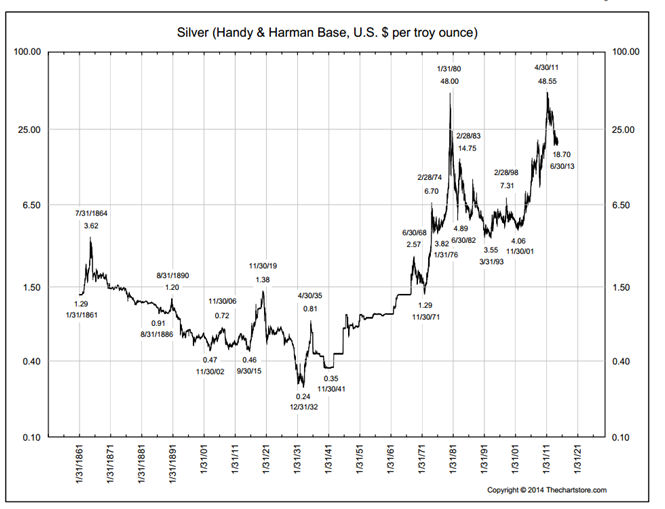
While the weekly and monthly charts are negative, Gold and Silver can be viewed from an ever larger historical perspective. Keep in mind, many a trader has gone broke with the correct longest-term historical perspectives. Historical perspectives are good for understanding, but not for timing investing and trading.

It can be argued that the longest-term trend is arguably up in Silver on the basis of this 100+ year chart.
SI_since 1861_semi log


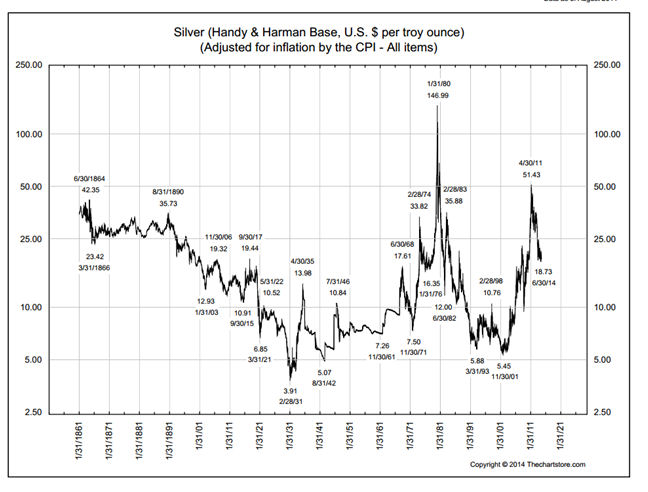
Silver could drop all the way back to $6 to $8 and remain in a long-term bull trend. There is one other chart of Silver worthy of display — the price of Silver adjusted for inflation (i.e., purchasing power as a function of “fiat” money). On this chart we see that Silver is right in the middle of a 100-year trading range — and in fact, has spent many more years in the past century below the current price than above the current price.
SI_semi log_inflation adjusted


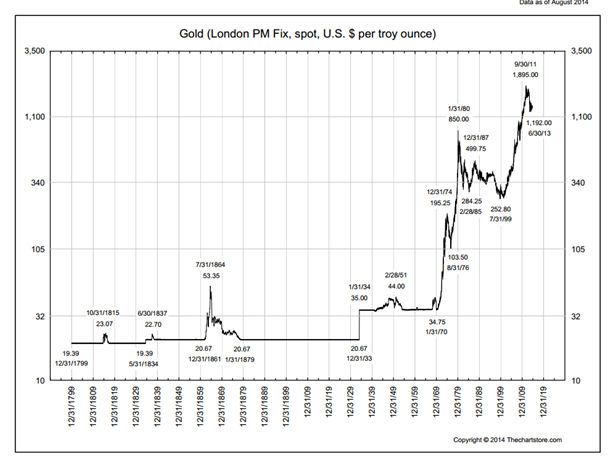
The 200-year chart of Gold shows a different picture than that of Silver. Gold is in a genuine “for real” historic bull market.
GC_semi log_200 yrs


There is a reason for the different “look” of the longest-term Silver and Gold charts — and you Silver bugs are not going to like what I say. Gold is a precious metal and store of value. Gold is actually a real investment medium. Silver is primarily an industrial metal (75% of annual Silver supply is off-taken for industrial uses). You can go ahead and argue with my statistic based on data provided to you in the latest report titled, “Why Silver Will Triple in Price in the Next Five Years,” published by some company that wants to charge you an arm and leg premium over spot prices to sell you coins from some “limited supply, one-time-only” Donald Duck release. But, my figure is right and their figure is wrong.

I actually believe in the long-term prospects for Gold. I think prudent people should be accumulating physical Gold during this bear market and sticking it in their safety-deposit boxes. As for Silver … no interest.

Please click here to read a copy of “The History of Gold Prices” updated late in 2013.

Markets: $GC_F, $GLD, $SI_F, $SLV, $GDX

Note: This perspective represents the type of analysis and thinking delivered on a regular and timely basis to members of the Factor email service. For information on this service, click the “Subscription” tab in the upper menu bar.

###


Chart patterns I am watching this week


The following is the weekly Factor Update sent to members of the Factor service for the week of September 7, 2014. To become a member of the Factor service, click here for “Subscription Membership.”  If the pdf is not visible below, click here.


http://www.scribd.com/doc/239067009/Factor-Update-September-7-2014

###

A bearish technical case for precious metals


Silver at 1304, Gold at 1075.

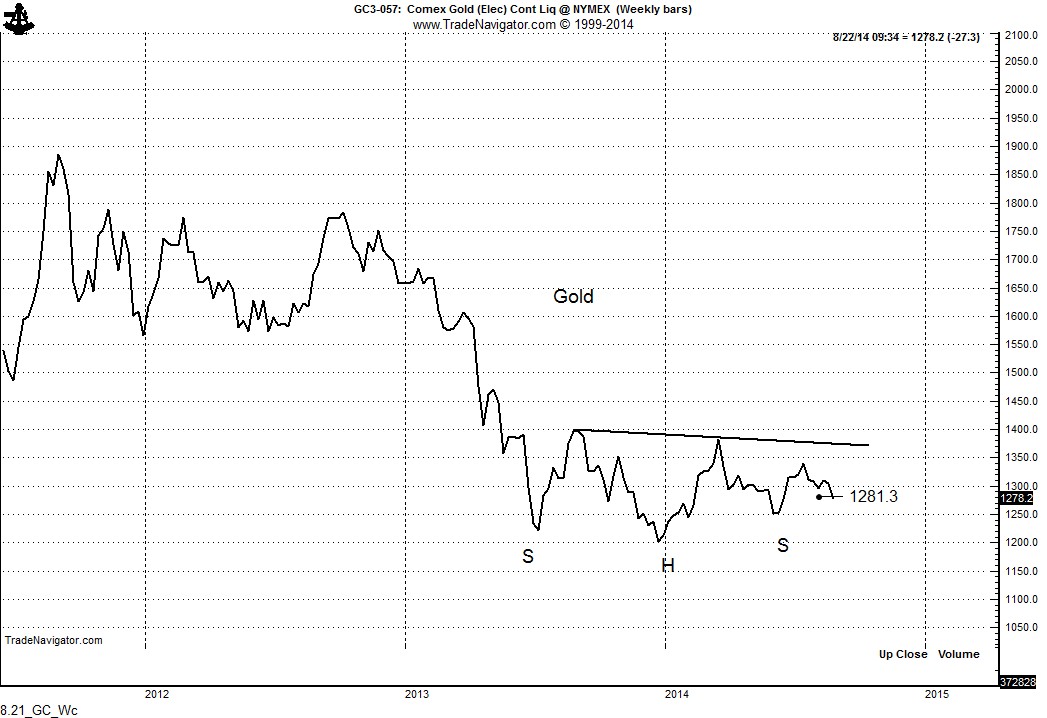
I know it is hard to believe. Personally, I am generally a Gold bull. I want the H&S bottom in Gold to complete, followed by a run to $2,000. But, a very bearish case can be made for the precious metals. First, the H&S bottom bullish case. The H&S pattern is a most reliable chart configuration — in fact, the most reliable of all classical chart patterns. A decisive close above 1,400 in Gold would be extremely constructive.

8.21_GC_Wc

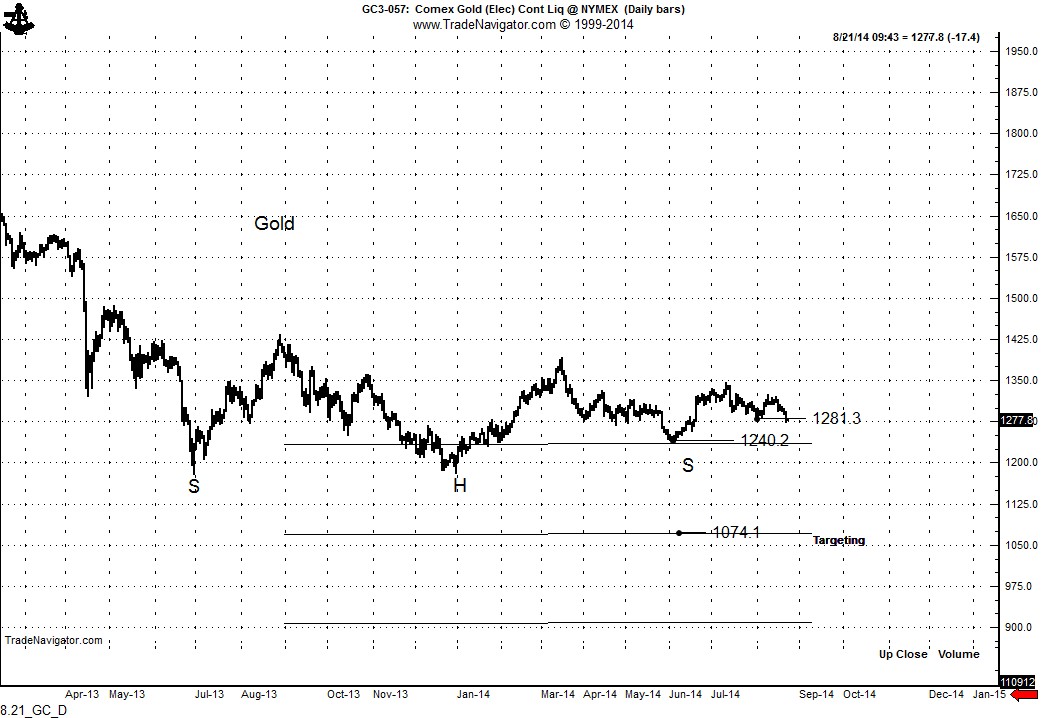
Yet, whenever a clear H&S pattern develops there is a possibility for a H&S failure. A close below the 1240 right shoulder low in Gold would be an indication that the H&S bottom is failing. The target would be 1074. A close below the late Jul low of 1281 would not be constructive — and, in fact, would suggests that the bears have control of the market. The market appears to be rolling over today. I will read a close below 1280 as a sell signal.

8.21_GC_D   8.21_GC_Dv2

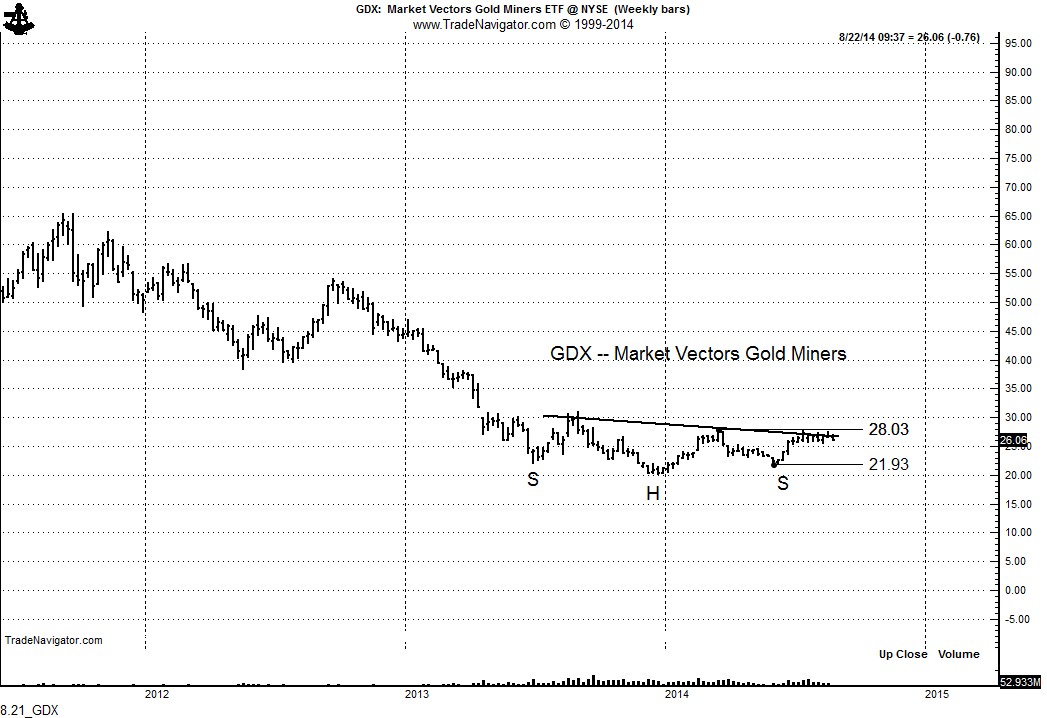
The same chart construction can be seen in $GDX, the gold miners ETF. A decisive close above 28.05 would complete the H&S bottom. A decisive close below 21.93 would complete the H&S failure.

8.21_GDX

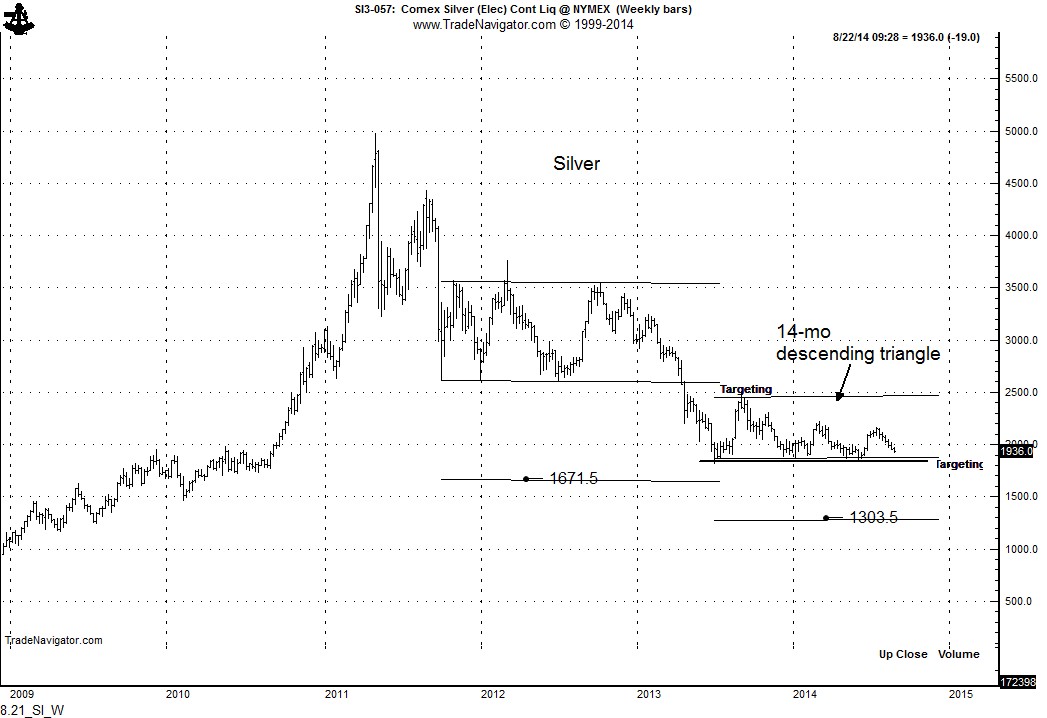
Then there is Silver — which, in my opinion is not even a precious metal in the true sense. I am constantly amazed by the number of people who think t he world is running out of Silver. Might they have believed the world was running out of carbon-based energy 10 or 15 years ago? These people also believe that the Gold/Silver ratio should be 20 to 1 just because some king of Spain declared it to be so some 500 years ago. I have commented numerous times during 2014 that Silver could be forming a descending triangle formation. This pattern generally has bearish implications. The top completed in Silver in Apr 2013 established an yet unmet target of 16.70. A decisive close below 18.00 would extend the downward target to 1300.

8.21_SI_W

$SLV, $SI_F, $GLD, $GC_F, $GDX


###

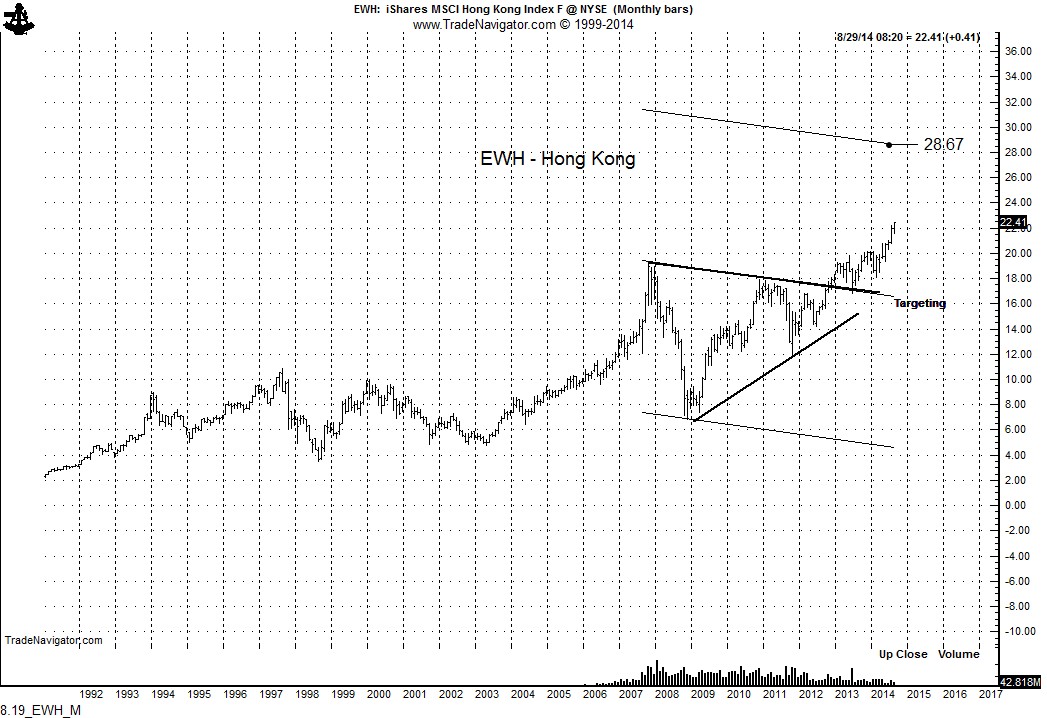
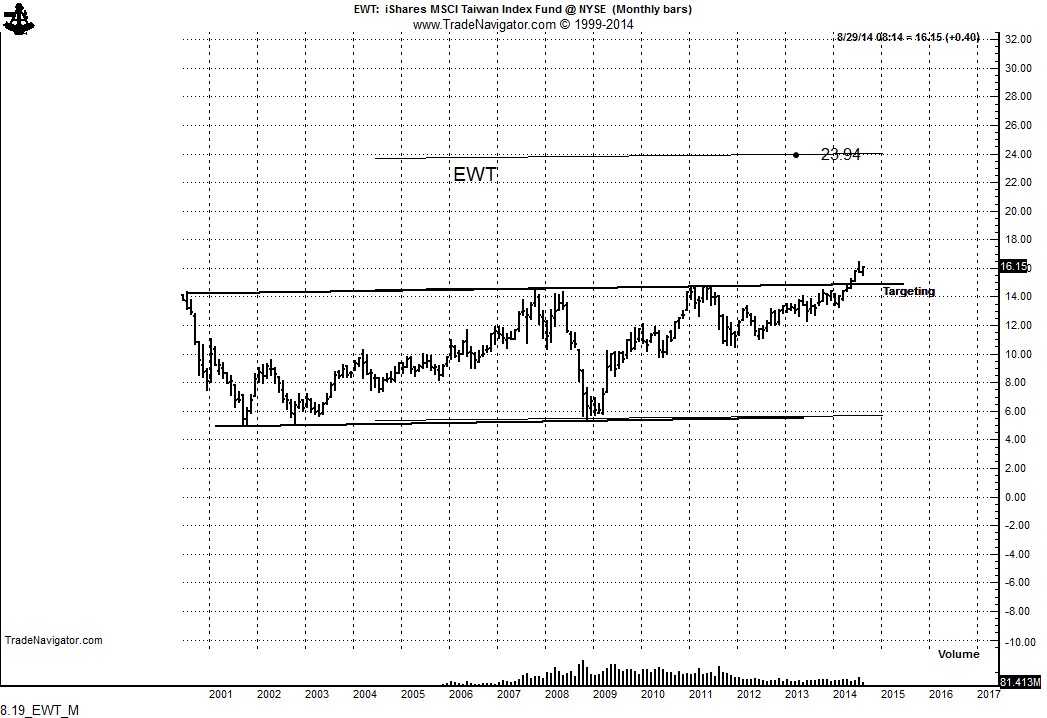
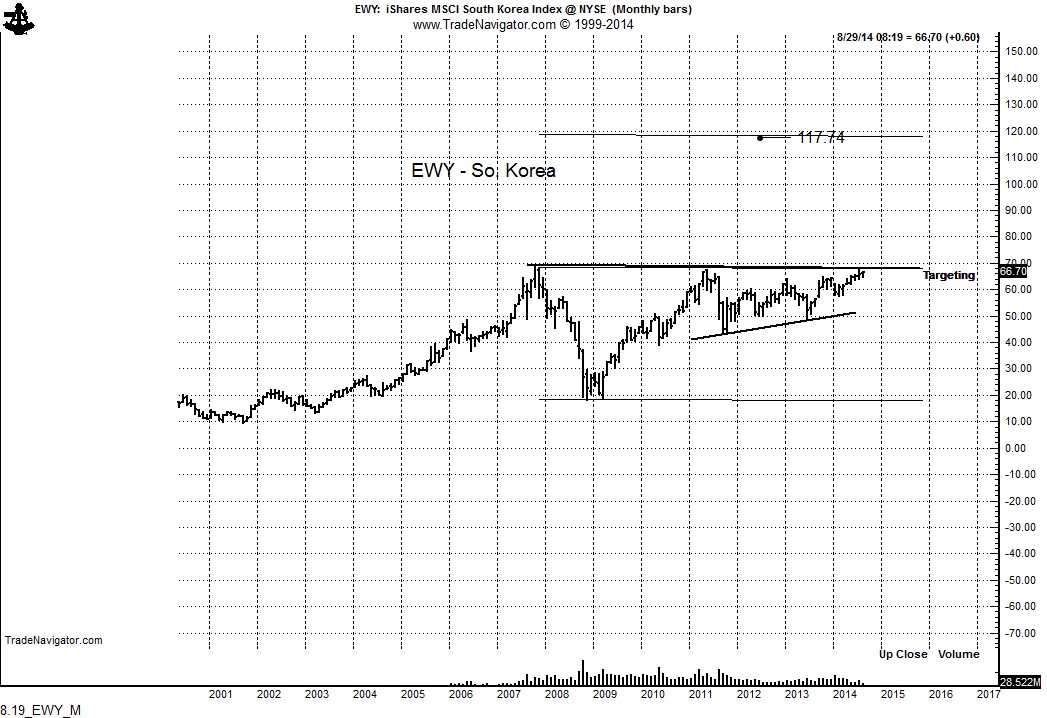
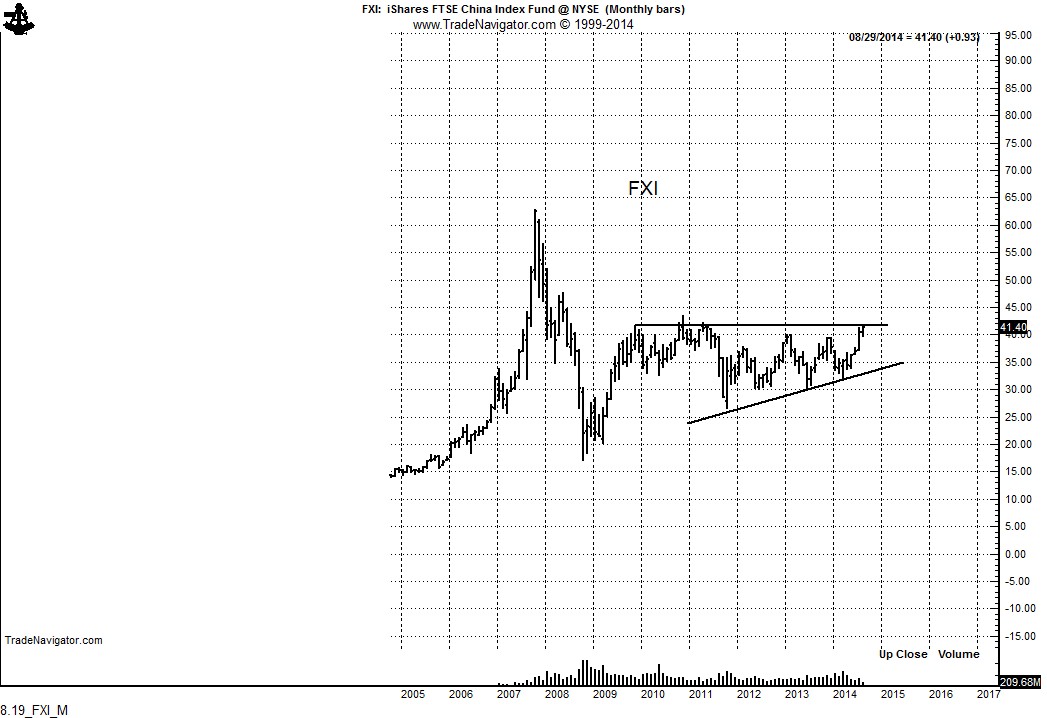
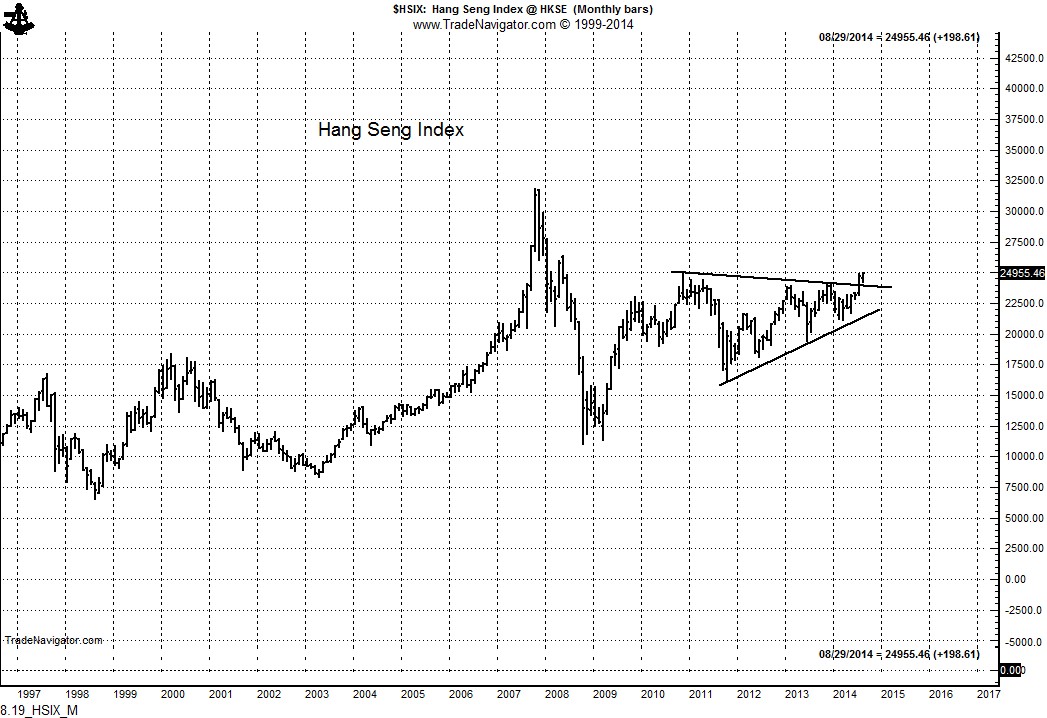
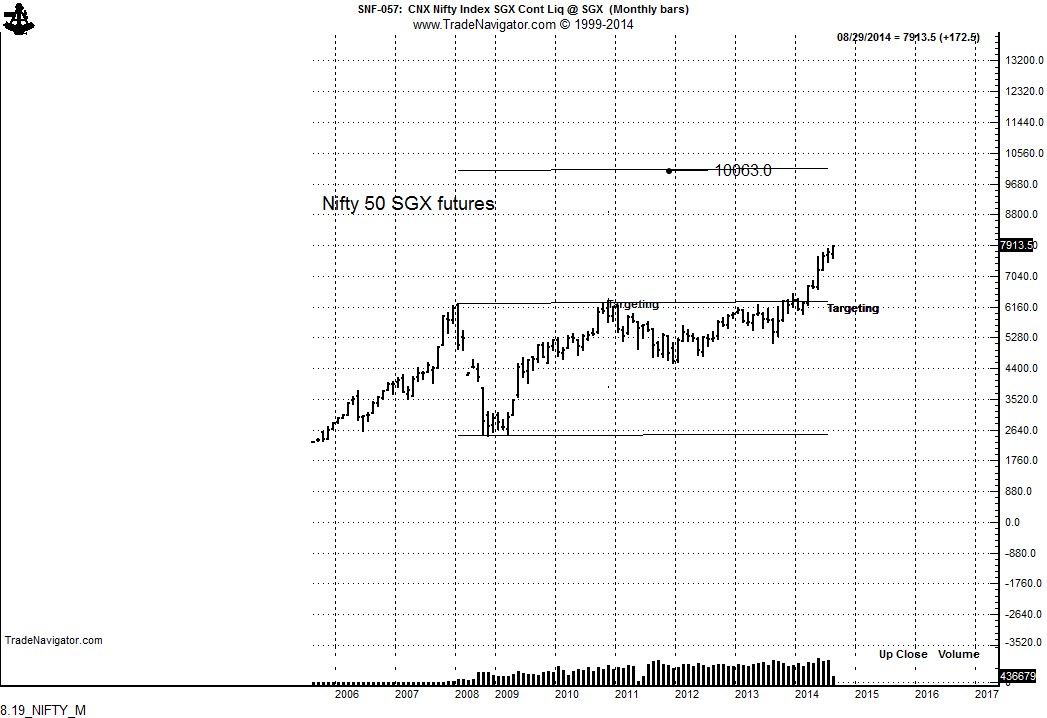
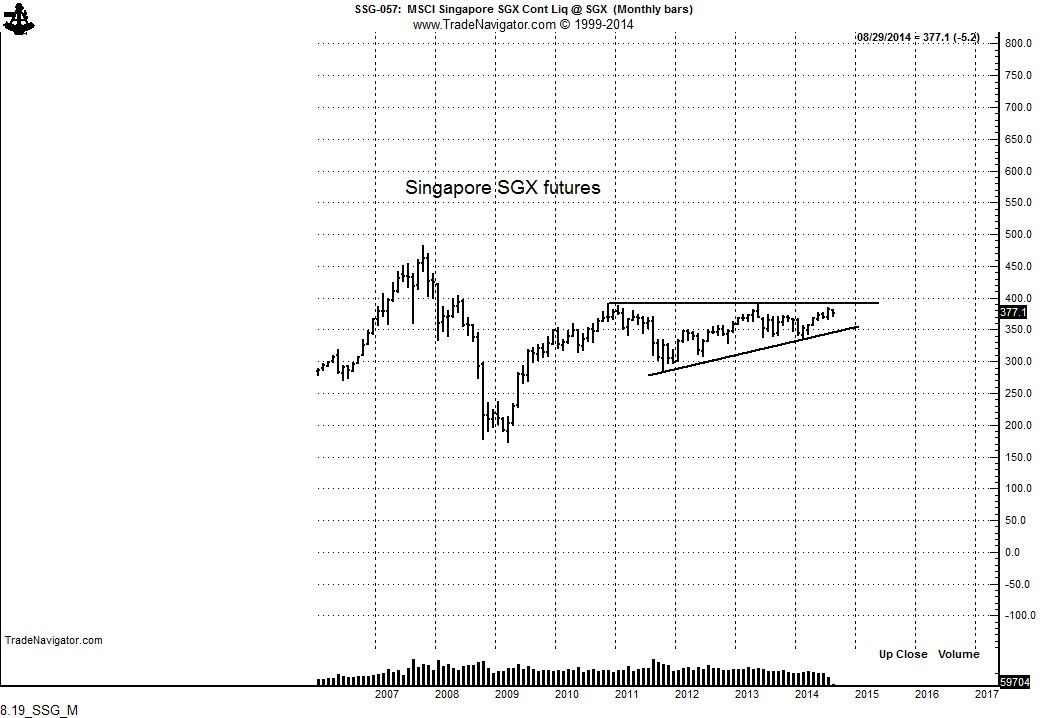
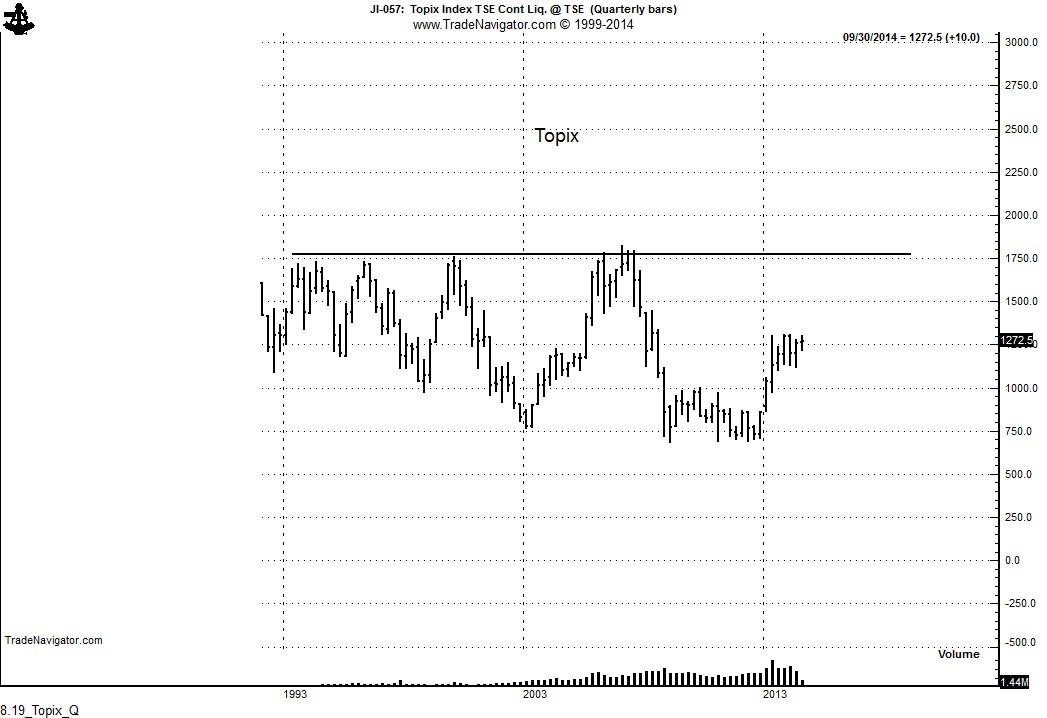
The Asian Tiger’s Roar is Getting Louder


Investors should overweight Asia


Note: I am a classical chartist. I do not follow macro economic factors. My opinions on equities and futures market contracts are based entirely on chart construction. 

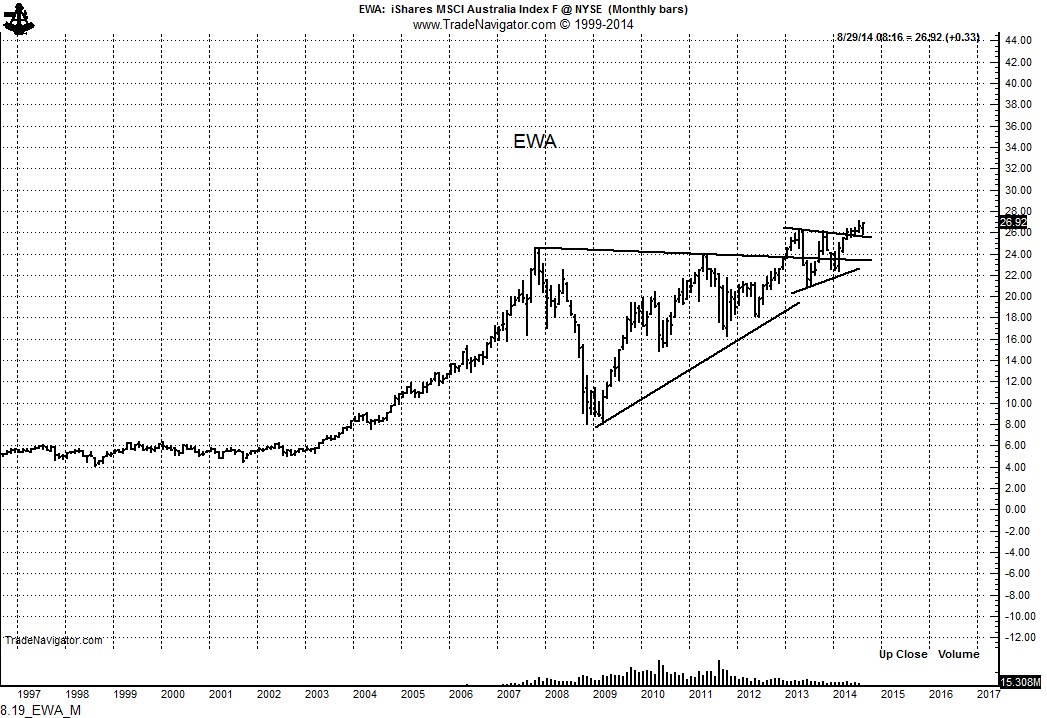
Over the past couple of years I have repeatedly alerted readers to a pending price explosion in Asian equities. The ship has left the dock and is leaving the harbor.

The charts below speak for themselves. The Asian stock markets — So. Korea, Taiwan, Hong Kong, Singapore, Australia, China and India are either in or will enter parabolic bull trends.

These stock markets will become bull trends for the ages. If you miss it, you can only blame yourself.

8.19_EWA_M 8.19_EWH_M 8.19_EWT_M 8.19_EWY_M 8.19_FXI_M 8.19_HSIX_M 8.19_NIFTY_M 8.19_SSG_M 8.19_Topix_Q


Note: The Factor Subscription service provides timely and insightful chart analysis to members two to three times per week, including a weekly review of all futures markets that Peter Brandt thinks offer particular profit opportunity. Click the Subscription tab on the top banner for more information.

$TOPX, $FXI, $EWT, $EWY, $EWA, $EWH, $NIFTY

###

A lesson in charting — great trendlines often begin at a price gap


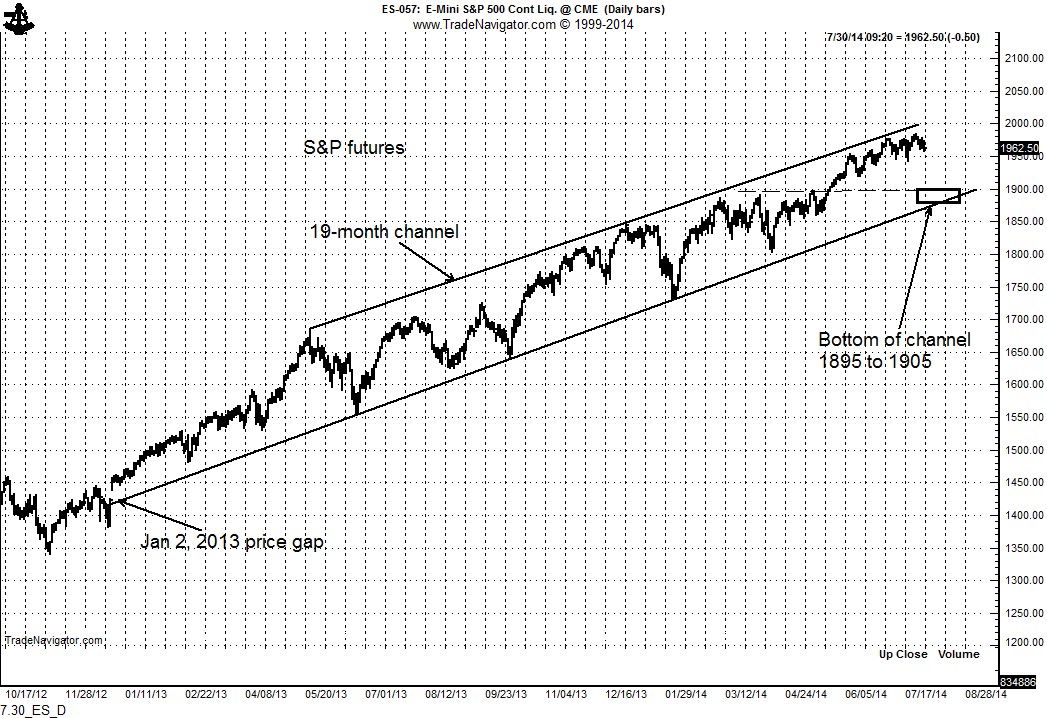
S&Ps are in a very well-defined price channel — a decline toward 1900 is possible

Beginners in the art of price charting desire to draw trendlines and boundary lines using orthodox high and low prices. Experienced chartists learn that charting is a much more nuanced craft.

The S&P futures market serves as a case in point.

Novice chartists would draw a trendline using the Nov 2012 orthodox low. However, trendlines are often born from important price gaps. The Jan 2, 2013 gap in S&P futures stands as a daily, weekly, monthly and yearly breakaway gap. Thus, a trendline is best drawn using this gap, not the Nov 2012 low.

On a daily chart, the S&P futures have been advancing within the boundaries of a 19-month price channel. Prices are finding resistance at the upper end of this price channel. Should the upper boundary turn prices down, the most likely support would be the lower channel line in the price zone of 1895 to 1905 (box). Interestingly, the 1895 level was significant resistance from Mar through May 2014. Often times, resistance, once penetrated, becomes support. This is NOT a prediction of a price decline to 1900. Personally, I think too many market participants are expecting a price correction for one to happen. Yet, a trader must constantly be prepared for a variety of scenarios.

7.30_ES_D

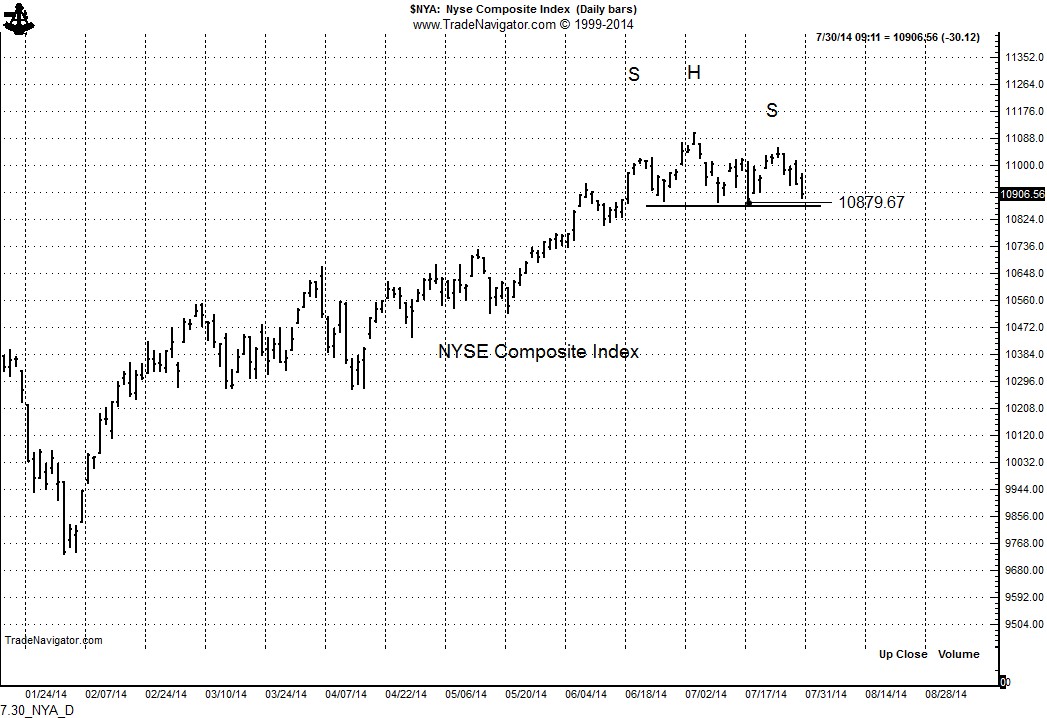
In my opinion (not worth much), the key to the S&Ps will be found int he NYSE Composite Index. $NYA is forming a well-defined H&S top pattern. A decisive close below 10,880 would complete this top and leave the S&Ps vulnerable for a decline to 1900.

7.30_NYA_D


$ES_F, $SPY, $NYA


This type of market research and charting lessons are continuously provided to subscribers to Factor membership. See information on the menu bar at the top of this page.

###
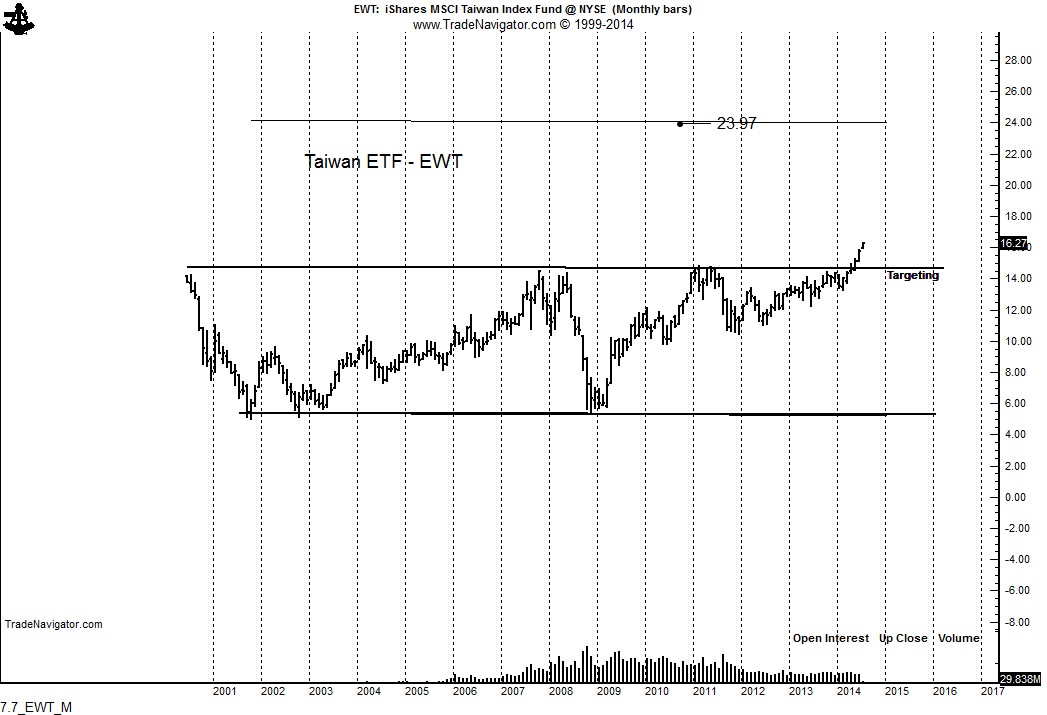
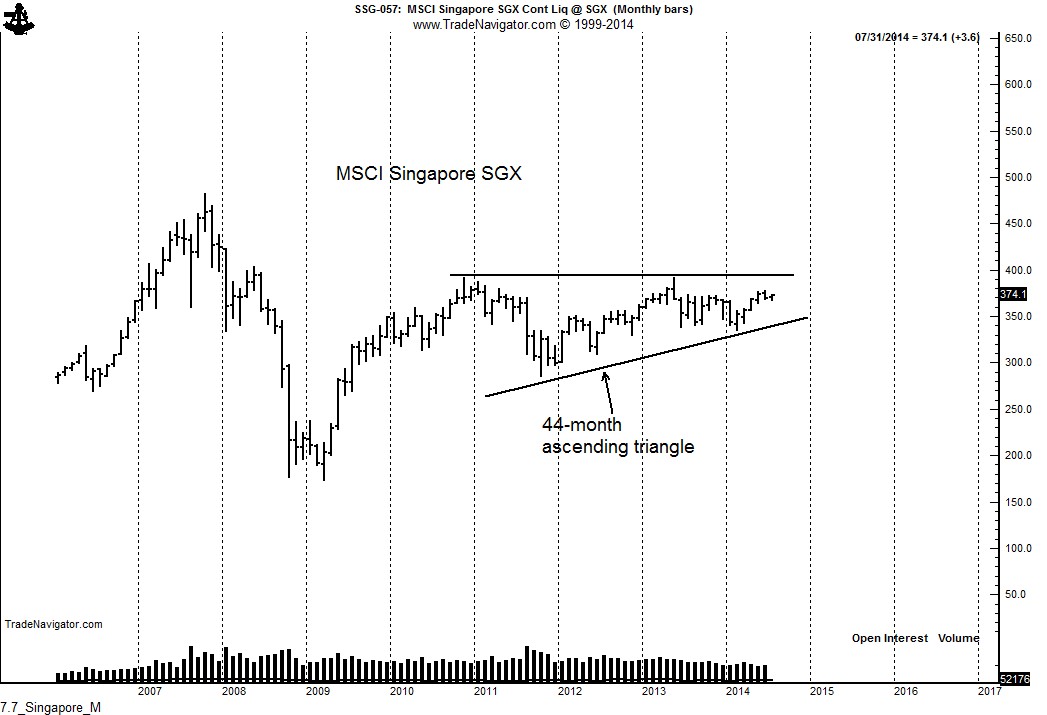
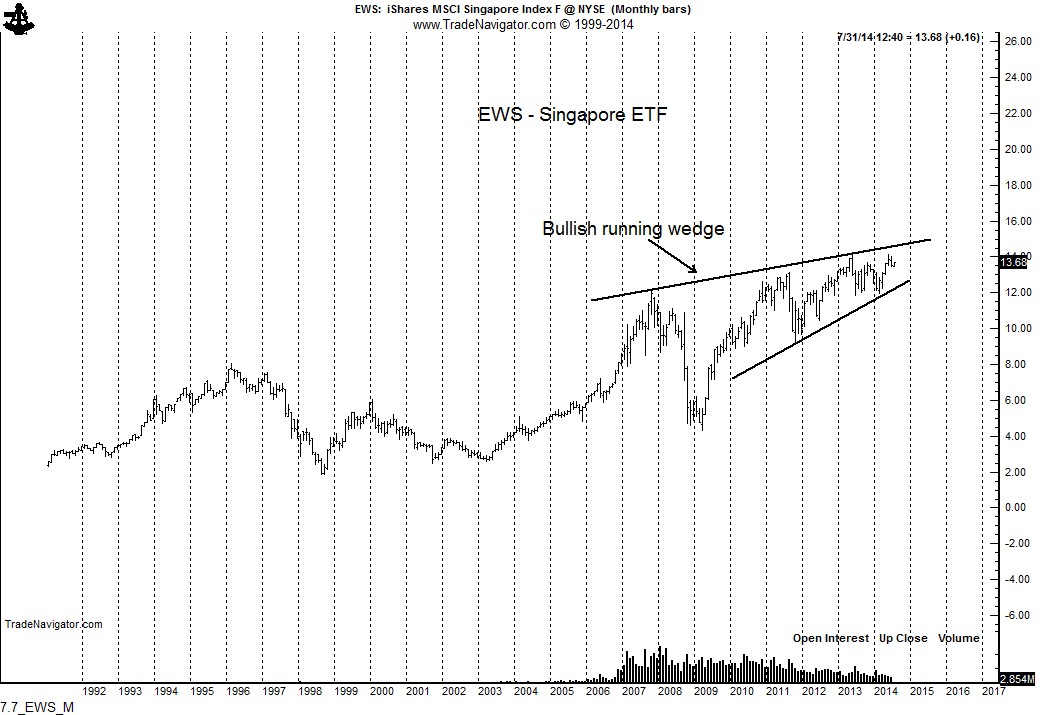
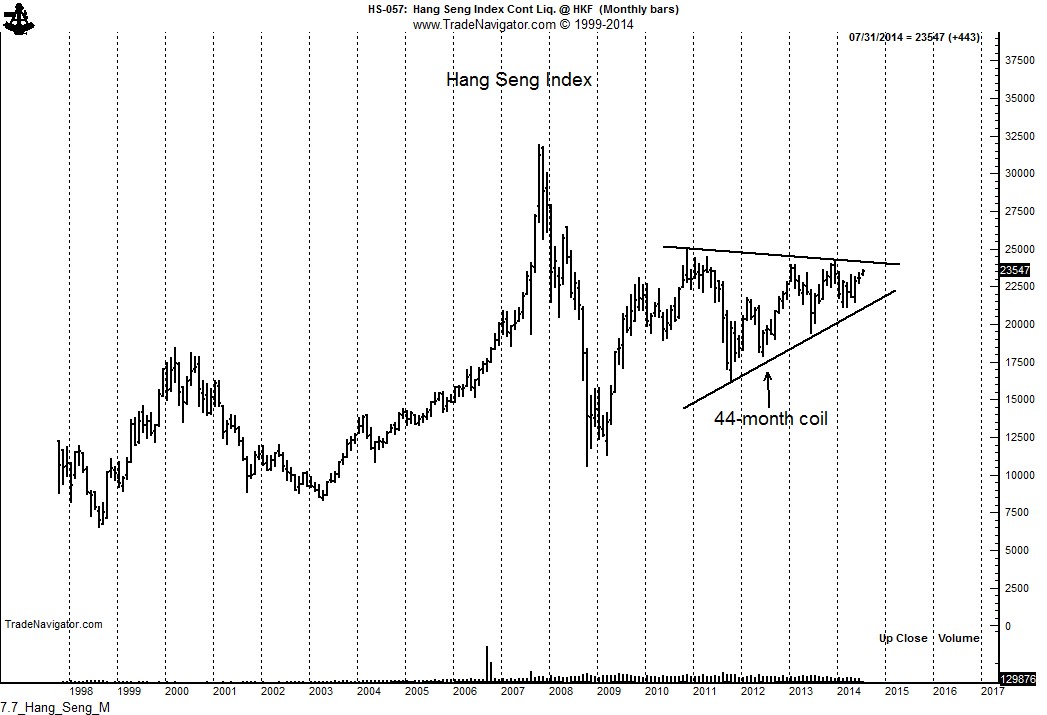
Asia — The Tigers are Ready to Roar

Tiger roar


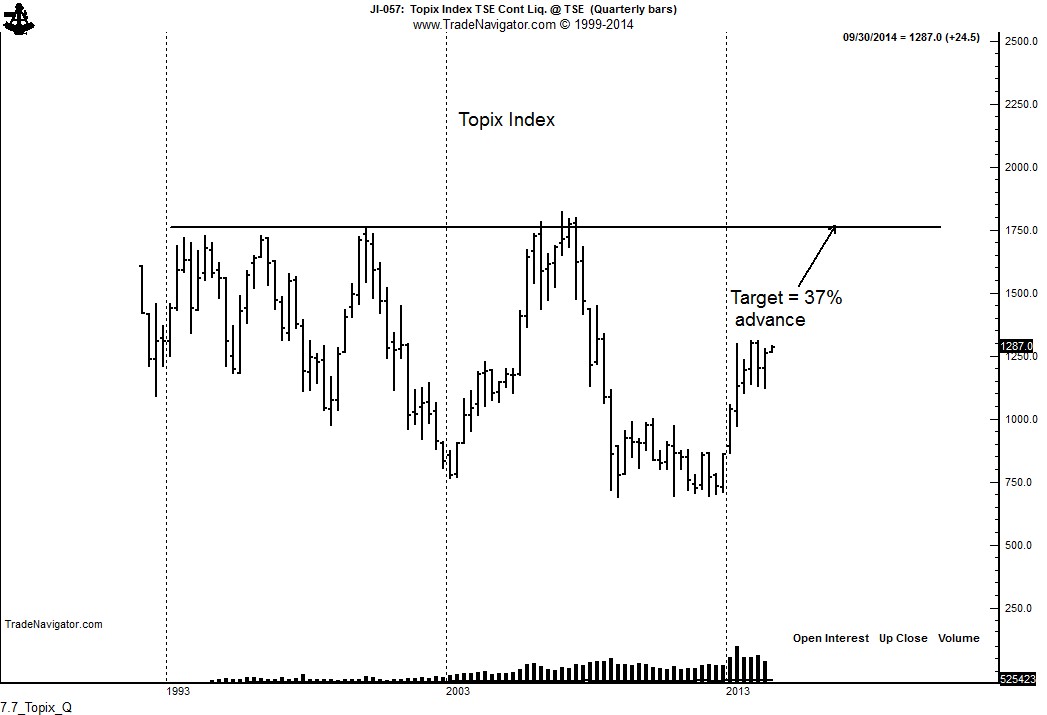
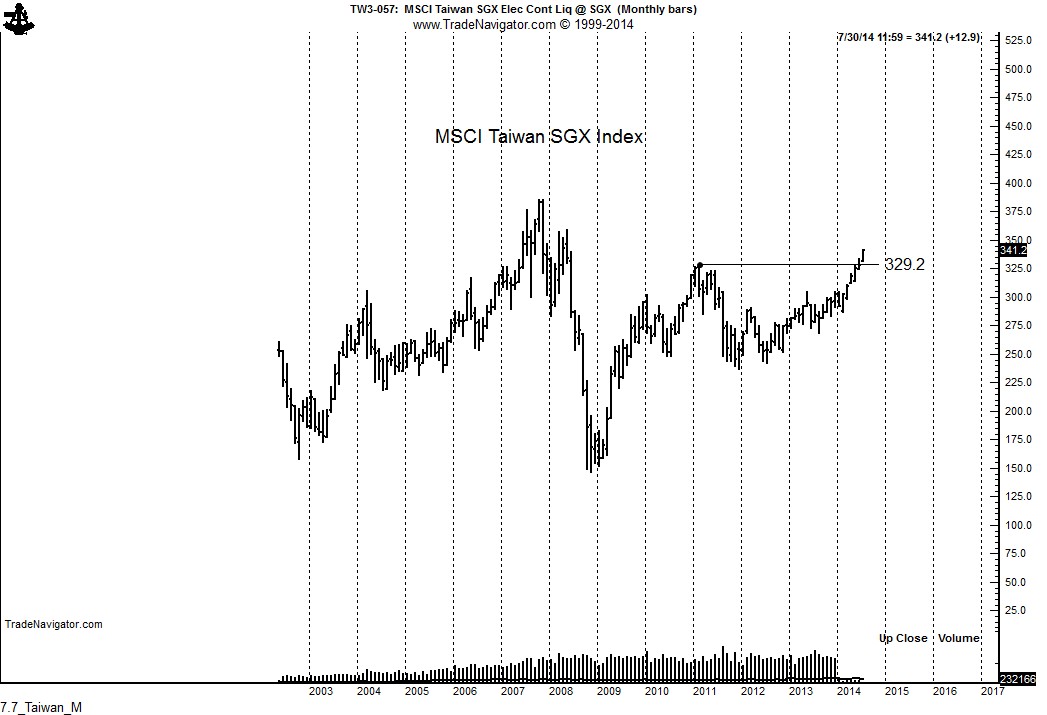
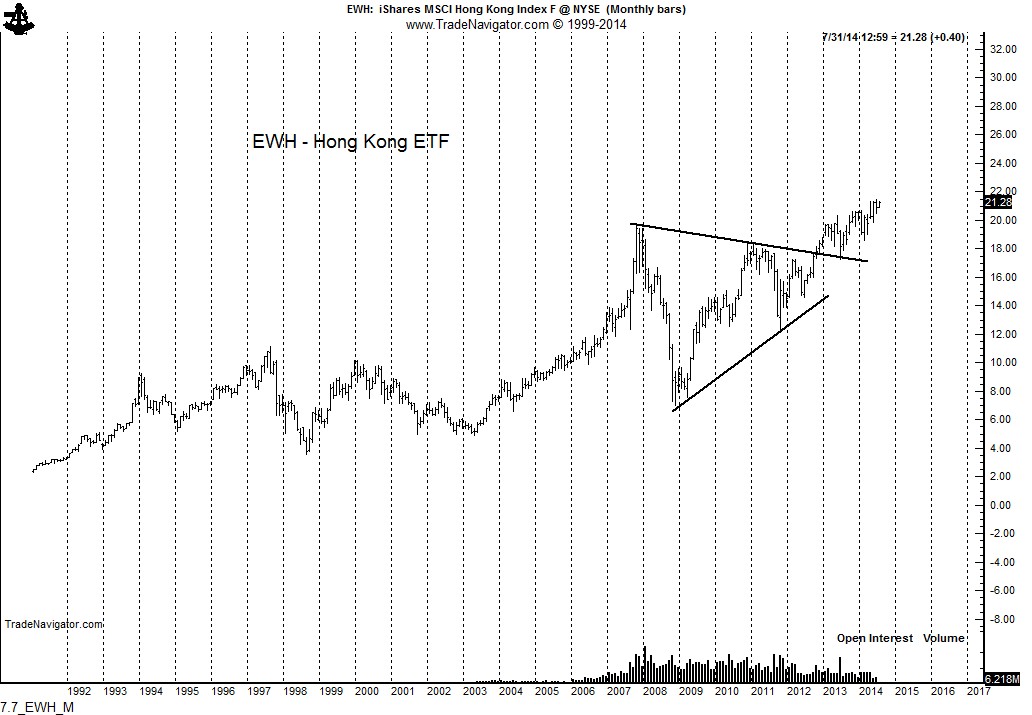
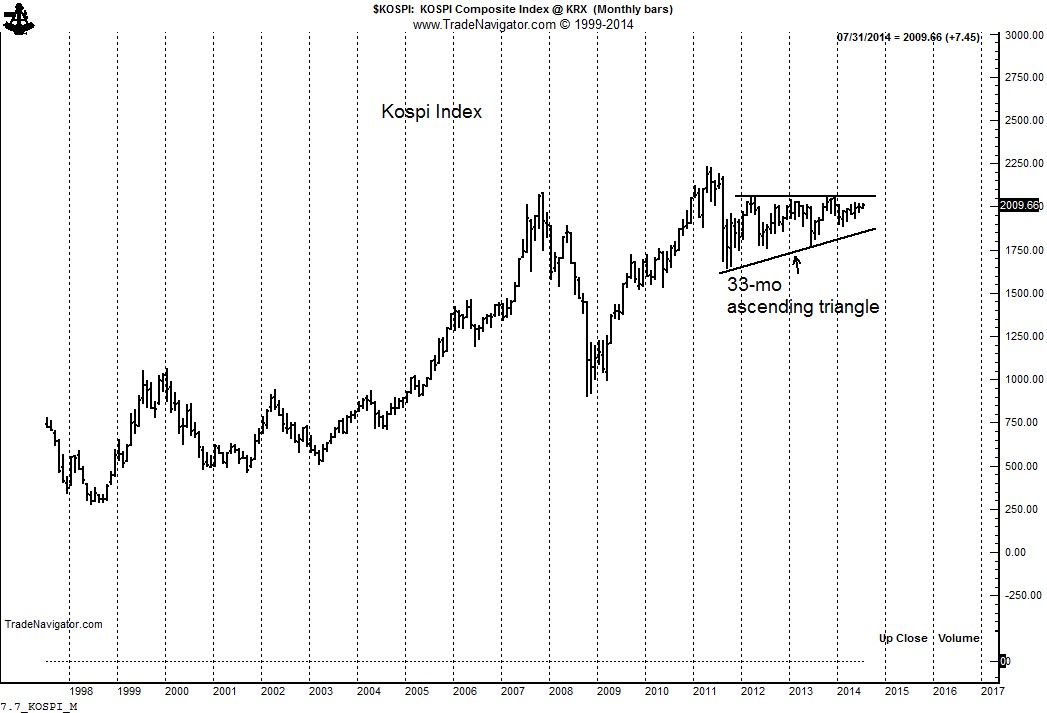
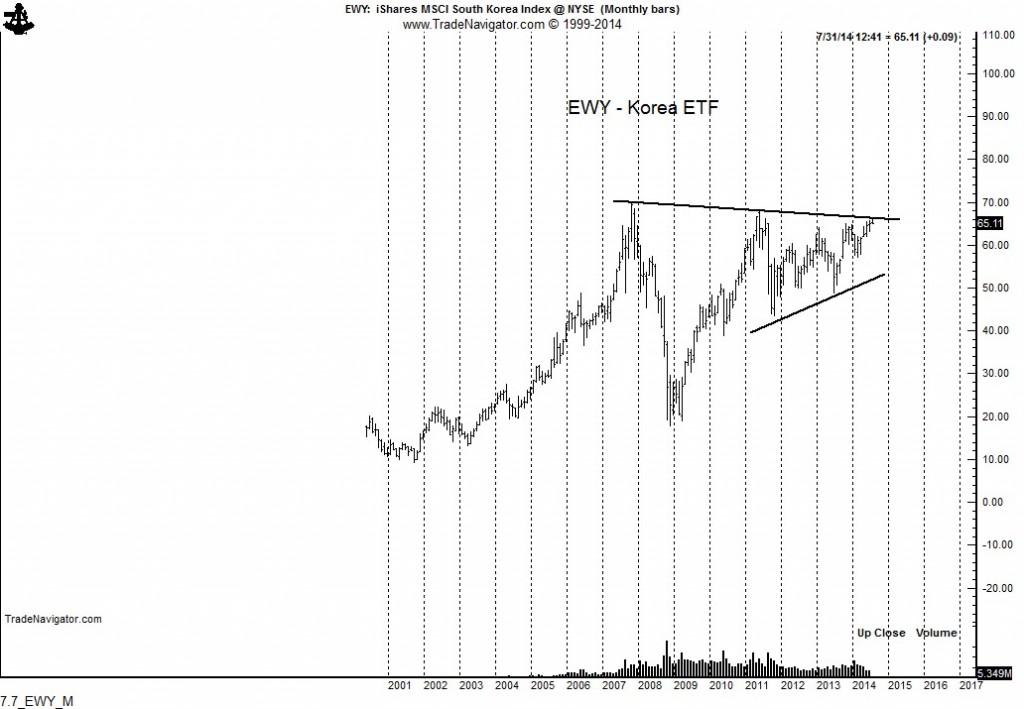
The price charts of Asian stock markets suggest that a significant advance has started or will start soon

I will let the charts speak for themselves. I believe the bull advance has already begun in Taiwan and will soon begin throughout Tiger land.

7.7_Topix_Q

7.7_Taiwan_M

7.7_EWT_M

7.7_Singapore_M


7.7_EWS_M


7.7_Hang_Seng_M

7.7_EWH_M

7.7_KOSPI_M

7.7_EWY_M

7.7_FXI_M


Asian equity markets are on the verge of explosive advances. Investors and traders need to find ways suitable to their investment strategy to have significant long exposure in Asian equities.


Markets: $STW_F, $NKD_F, $SSG_F, $EWJ, $EWT, $EWY, $FXI, $EWH

Note: This is the type of research provided on a regular basis by Factor LLC to member of the Factor Service. For more information, click here.


###


Have precious metals begun a new bull market?


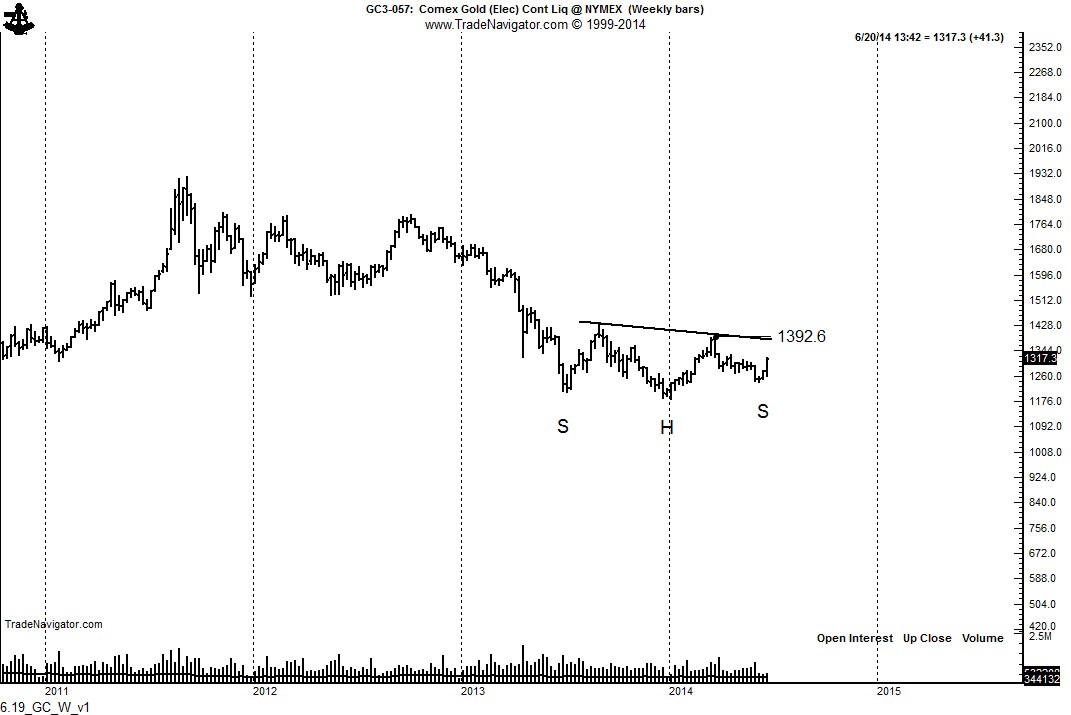
Gold is forming a possible massive H&S bottom

On Sunday, June 15, I issued a Tweet that Gold was forming a possible H&S bottom pattern. See here for chart posted.

Additional evidence exists that the precious metals are forming major chart bottoms that could propel the next bull market phase. To gain a fuller understanding of the importance of price charts in Gold, please read the “Chart History of the Gold Market,” last updated in November 2013.

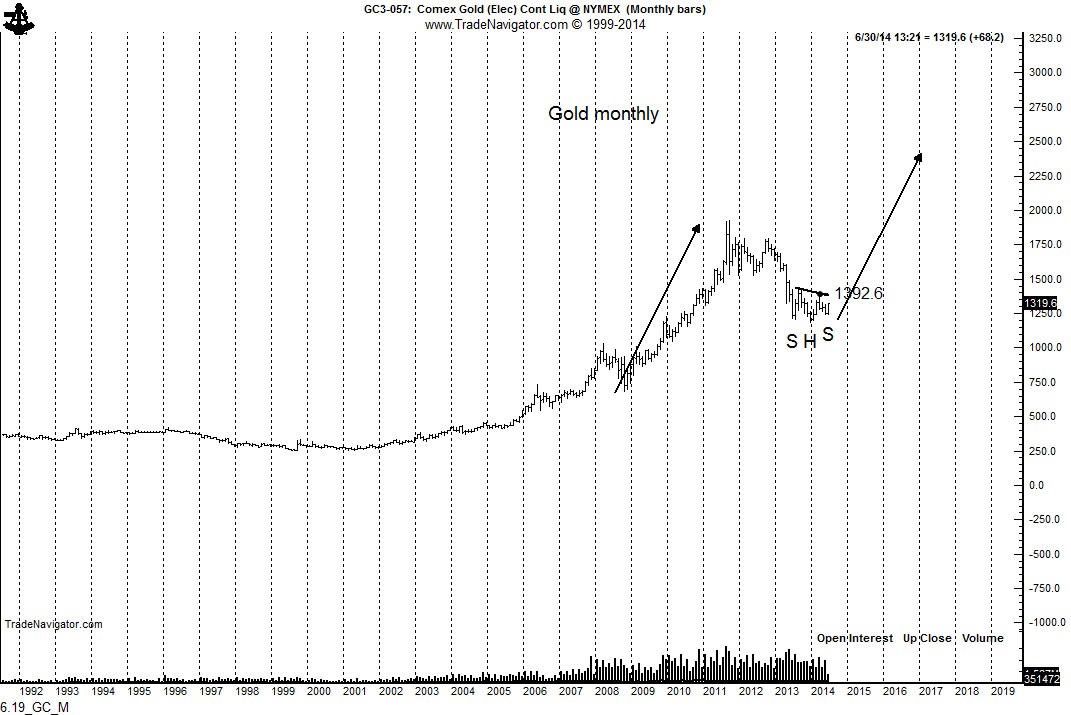
The H&S bottom in Gold is now clearly defined on the daily and weekly charts (weekly chart shown). The rally today is strong indication that the right shoulder low is in place. A close above 1400 is required to complete this bottom.

6.19_GC_W_v1

In the event of such a close, the swing target in Gold would become 2,400 as shown on the monthly graph. This swing target assumes that the advance from the Dec 2013 low will equal the advance from late 2008 through Sept 2011. Remember, a H&S bottom is not a H&S bottom until it is completed.

6.19_GC_M

Silver also presents an interesting technical study. The decline into the May low had all the earmarks of a bearish descending triangle. Yet, the market was on the ropes but could not be put down. While failed descending triangles are not typical bottom patterns, they do occur.

6.19_SI_W

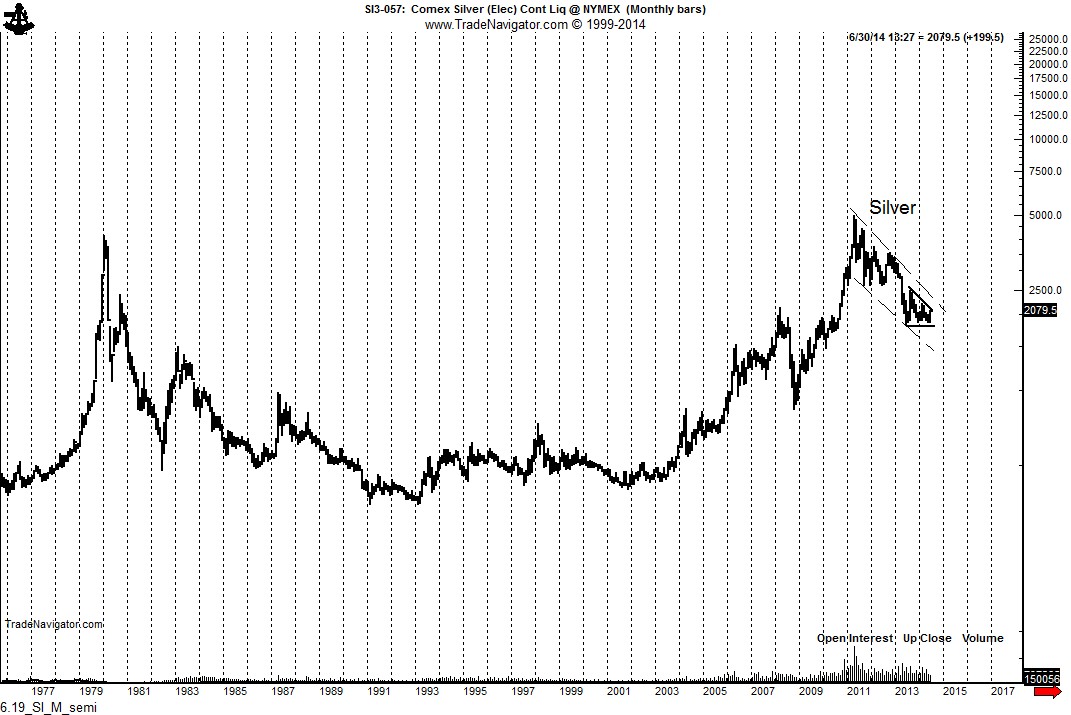
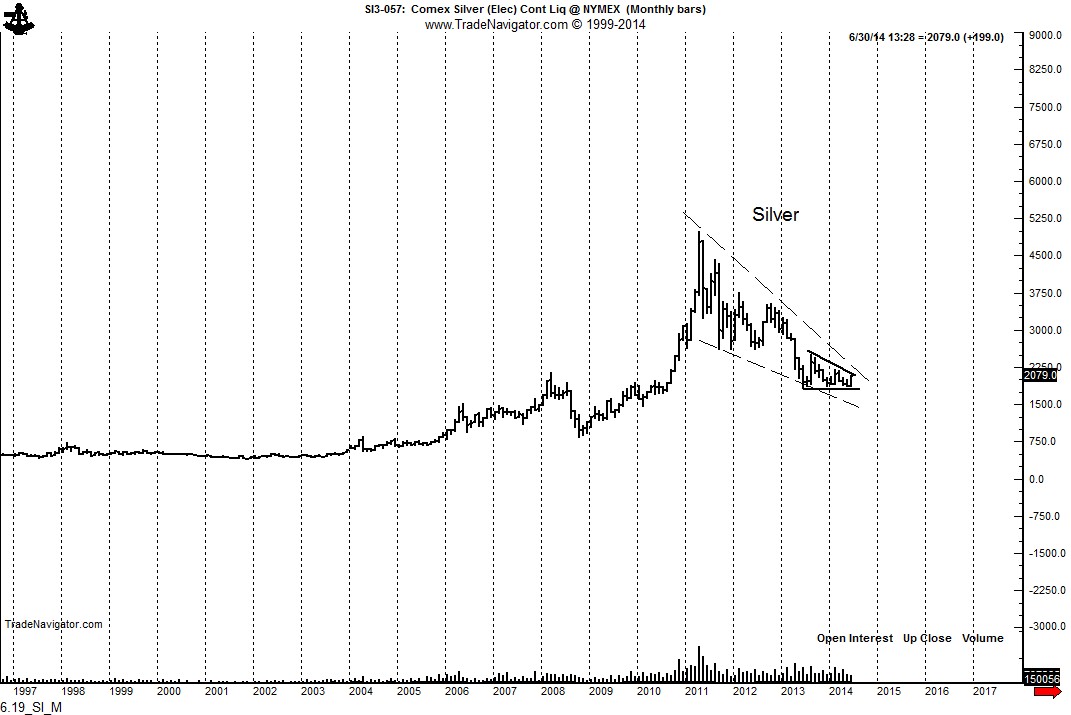
Also, it is possible to argue that the entire period since the Apr 2011 high has formed a channel on the semi-long monthly graph. On an arithmetic scale, the period since the Apr 2011 high has formed a bullish wedge.

6.19_SI_M_semi

6.19_SI_M

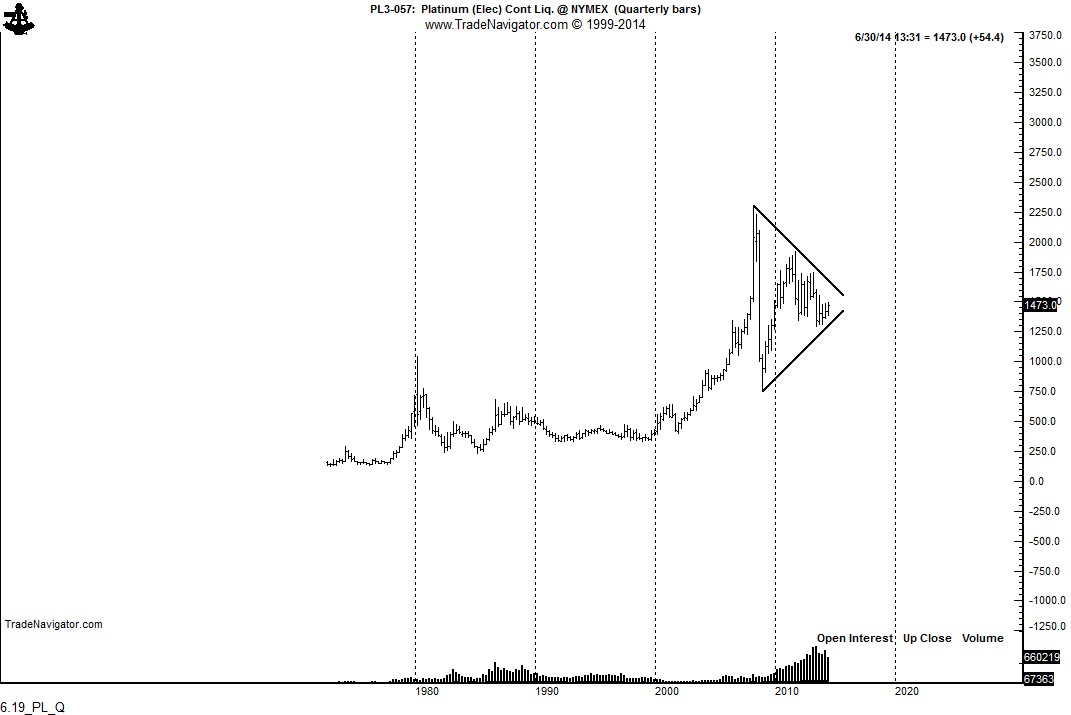
The long-term chart of Platinum exhibits a possible 6-year triangulation as part of a bull trend that began in the last 1990’s. If this labeling is correct, Platinum’s target could extend toward 2,750. Obviously, this will not happen overnight.

6.19_PL_Q

Traders should be alert for buying opportunities consistent with their approach to trading.


Markets: $SLV, $GLD, $GC_F, $PL_F, $SI_F


###
British Pounds getting ready to dump


Overall technical outlook is consistent with trouble ahead

Three technical observations are worthy of note:

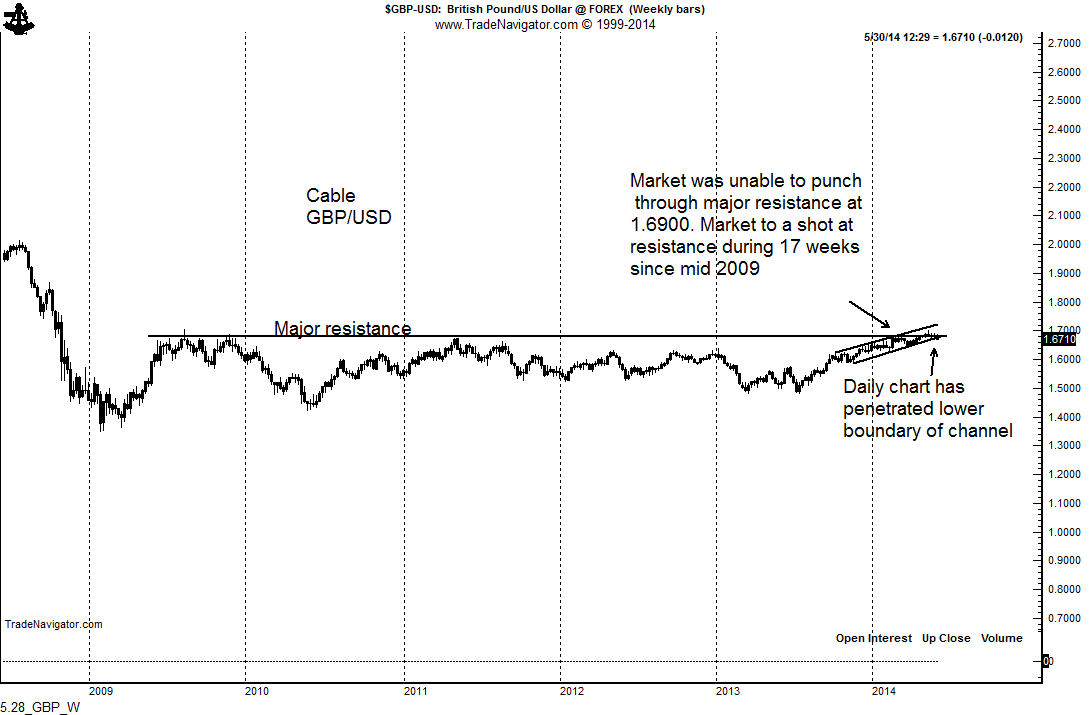
1. The weekly chart resistance at 1.6900 has turned back rallies during 17 different weeks since 2009. The market was poised for an upside breakout in recent weeks, but the bulls were unable to get the job done.

5.28_GBP_W

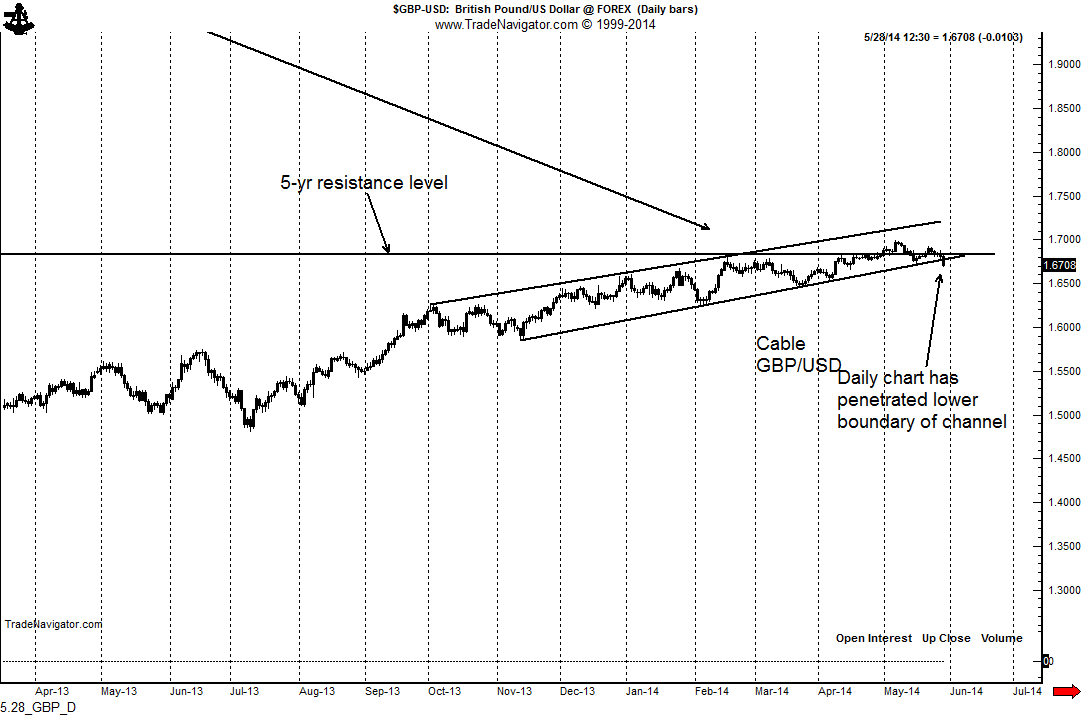
2. The daily chart has penetrated the lower boundary of an 8-month channel. This is further indication that the resistance at 1.6900 has turned the market negative.

5.28_GBP_D

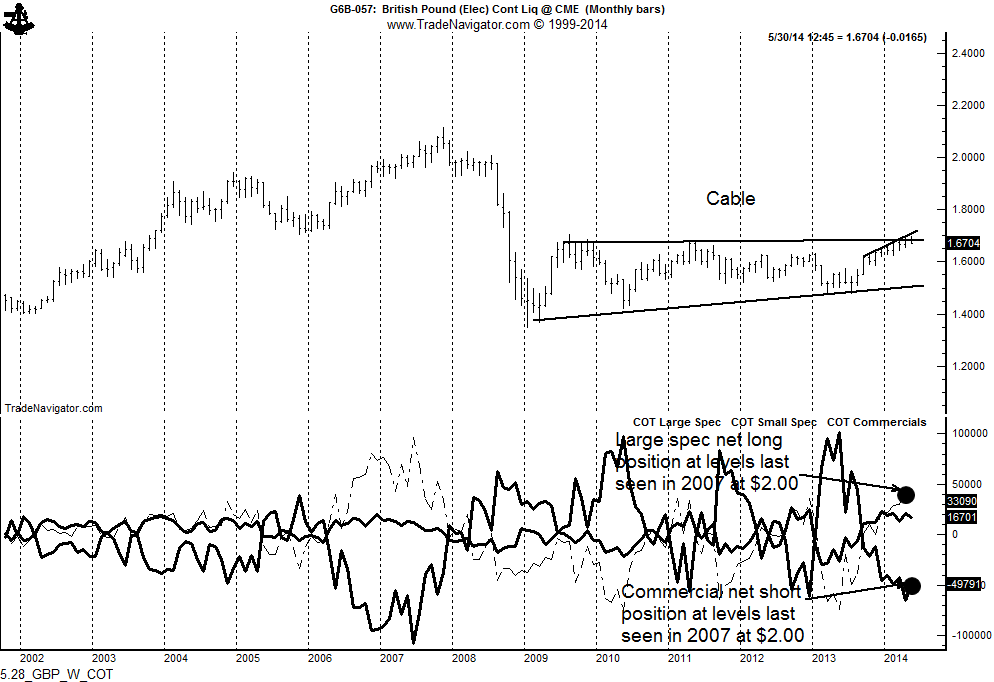
3. The CFTC Commitment of Traders data indicate that the profile of ownership is such that heavy liquidation of low positions by speculators could put prices at jeopardy.  The last time the profile of net positions was similar to the current profile of ownership was in 2007 when the Cable was trading well above $2.00. The Pound declined 37% in the following 14 months.

5.28_GBP_W_COT

$GBPUSD, $G6B_F

Note: This is the type of chart analysis is issued to members of the Factor Email Service on a regular basis. To obtain more information about the Factor Email Service please click the “Subscription Membership” tab in the menu bar.


###