Even if Gold and Silver are driving to the final low, so what? It still is no reason to be long.
This content is for members only
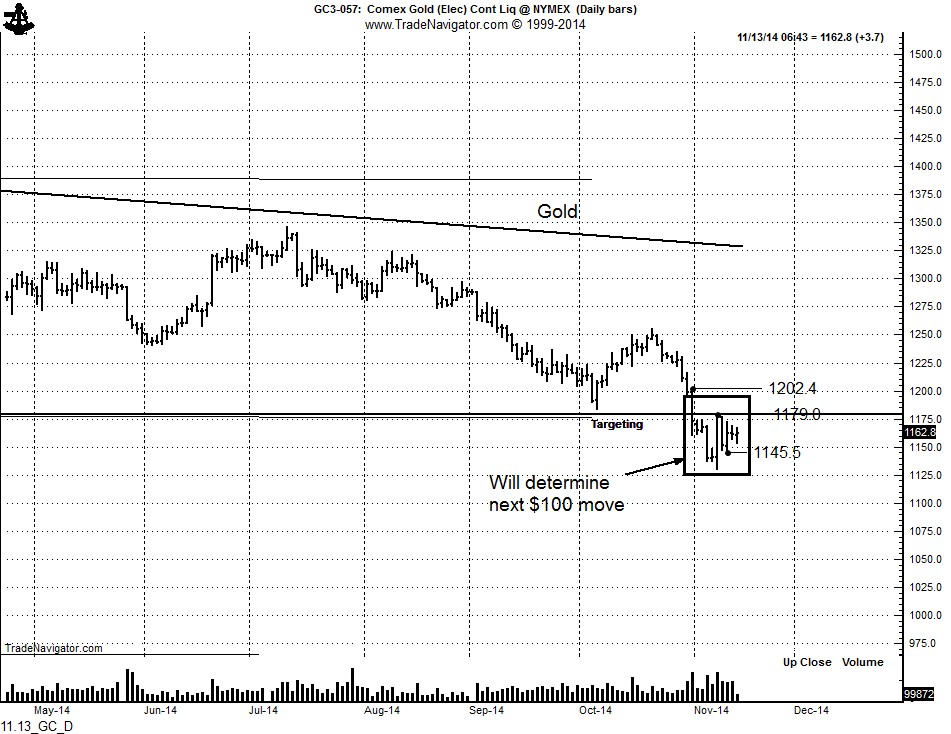
Keep your eyes on the precious metals. Gold and Palladium could be bottoming. A decisive close by Gold above 1180 and then above 1202 would be strong indications that the 3+ year bear market has run its course.
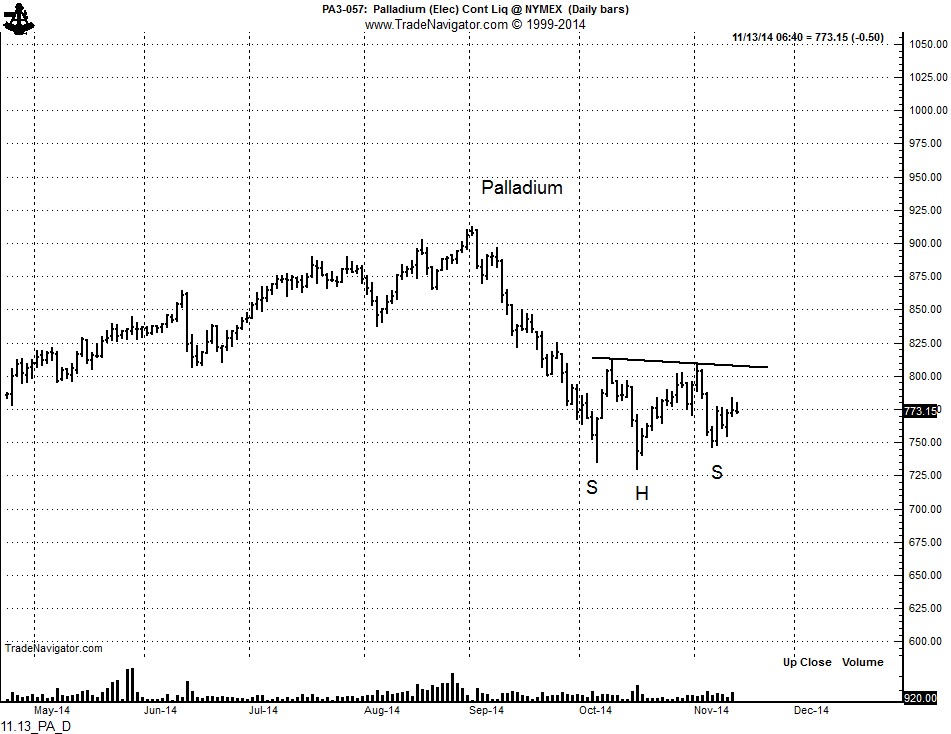
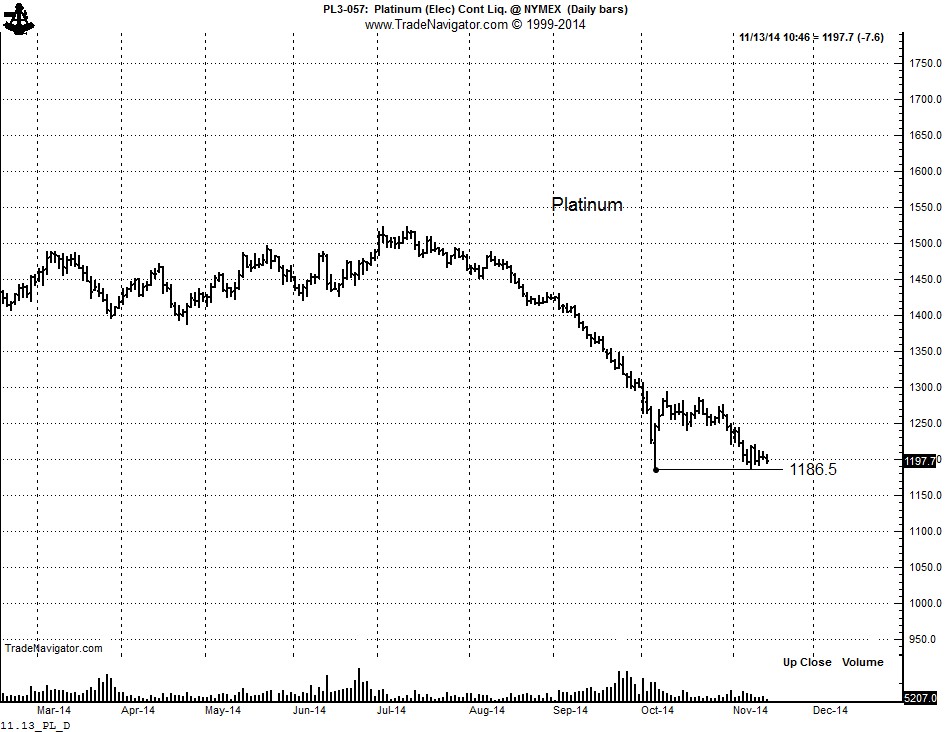
Palladium is forming a 9-week H&S bottom pattern. The key levels to watch for the next direction are the Nov high at 809 and the Nov low at 746.25. More bearish is the Platinum chart. A new low under 1186 would not be constructive.
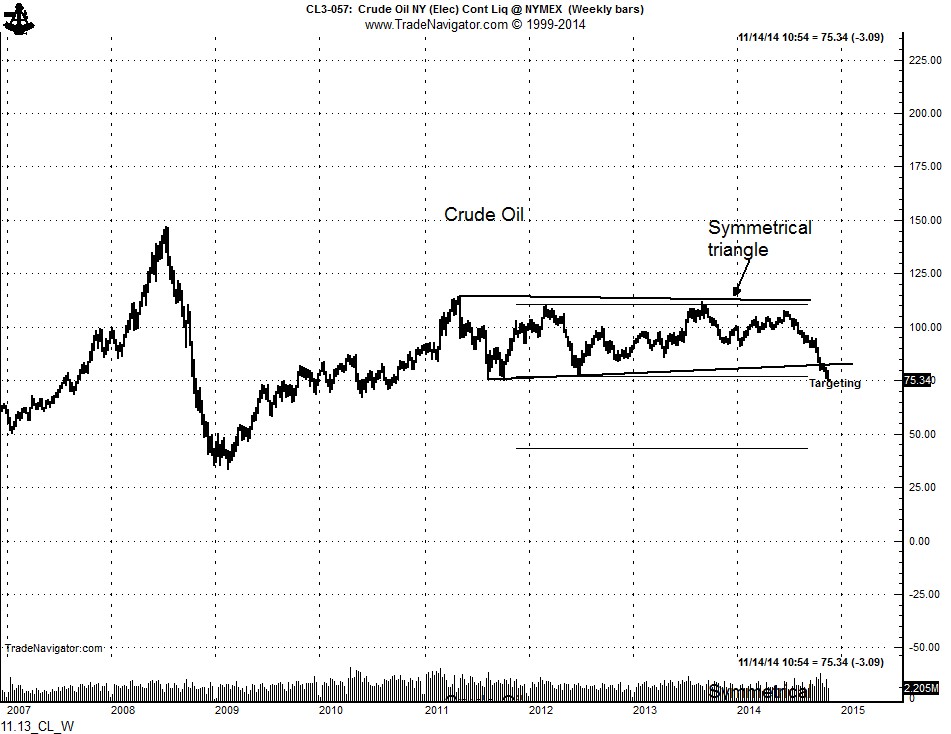
The weekly Crude Oil chart explains the current weakness. The 3-1/2 symmetrical triangle on the weekly chart has a target of $50. Look for real estate deals in North Dakota.
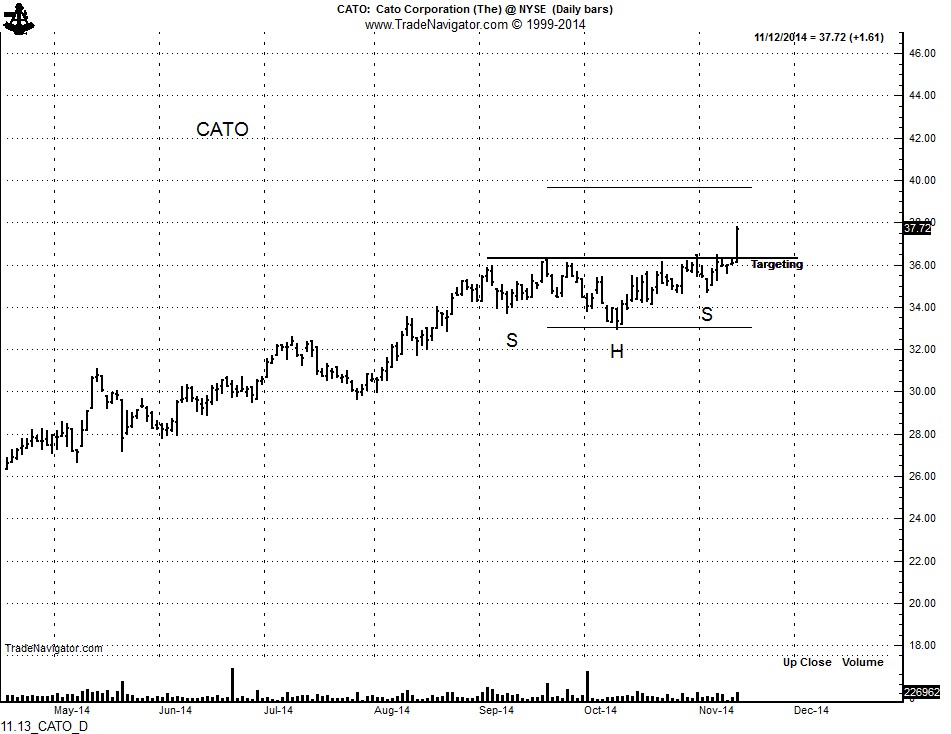
Kuddos to Factor member Paul S. for alerting me to CATO. On Tuesday he correctly interpreted the continuation H&S pattern in this stock and is profiting accordingly. Way to go, Paul.
###