The Public Blog site
Factor Readers,
In light of recent news, I’m making the latest ChartWizards report (12/30/25) publicly available below.
This report was released before Maduro’s arrest, and outlines several key themes and trade setups that remain highly constructive.
New long positions:
Other areas of focus:
TSM, INTC, Metals, Nuclear, Defense, AI
I also discussed waiting for a Sign of Strength in Bitcoin. A strong close above $93,000 would be a meaningful technical development worth monitoring.
Don’t wait for headlines to confirm breakouts.
You can sign up for future ChartWizards reports here:
👉 https://tinyurl.com/ChartWizards-Sign-up
Related YouTube video (12/10/25)… “Maduro’s days are Limited”.
copy of Market Musings 12.30.25 by JK– JK
#ChartWizards
Here’s a free 1-pager and “cheat sheet” for understanding interest rates. The three minute included below is a simple review or reminder of the impact of rates on our markets.
The next FOMC meeting is one week away, December 10, 2025. Stay informed – make sure you are subscribed to ChartWizardsNFT Macro Reports.
Thanks for reading,
JK
interest rate primer by JK

Traders,
Check out this 2-minute video on Loss Aversion attached below.
Loss Aversion is one of the mental traps that even the best traders fall victim to. Daniel Kahneman and his associate Amos Tversky won the Nobel Prize for identifying it.
In short, Loss Aversion is the tendency for people to irrationally risk more money (“double down”) in order to avoid a loss. The [bad] feeling of a loss is physiologically more powerful than the [good] feeling of an equivalent gain.
Sign up for Chart Wizards if you’re serious about trading. It’s the best deal for traders, and Factor members get a special discount.
Thank you for watching, and safe trading,
#JK – ChartWizardsNFT
Also: See my bold interest rate outlook and latest market update here (VIDEO).

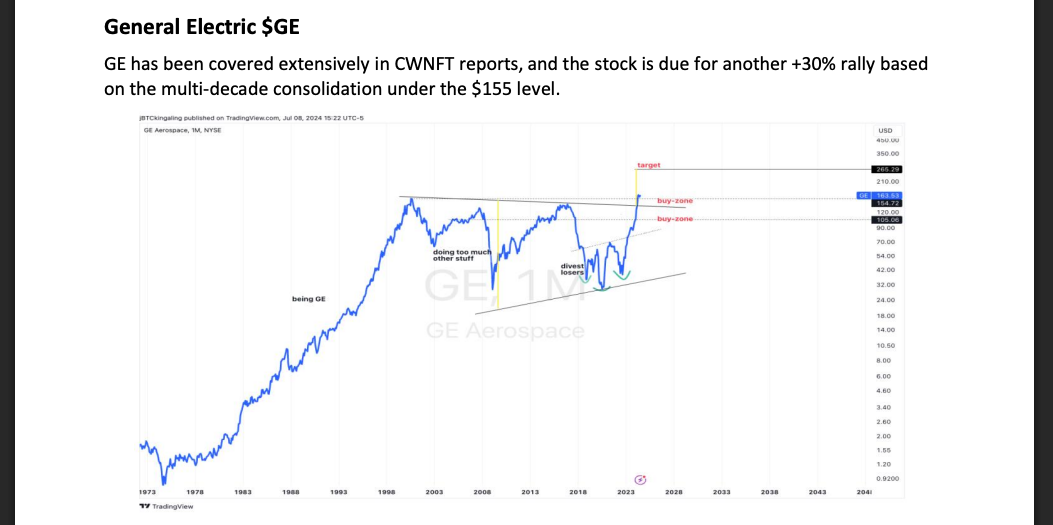
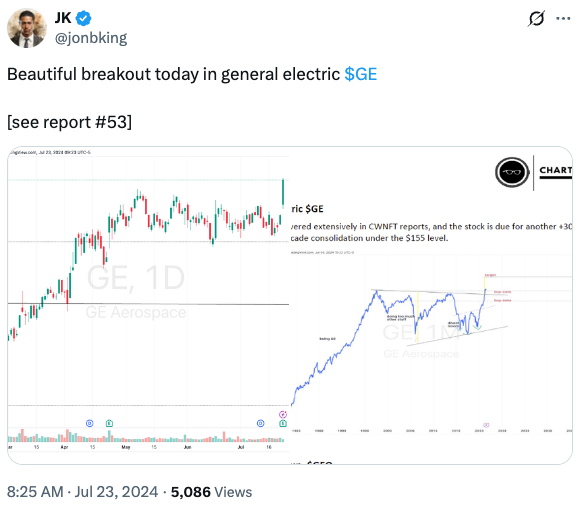
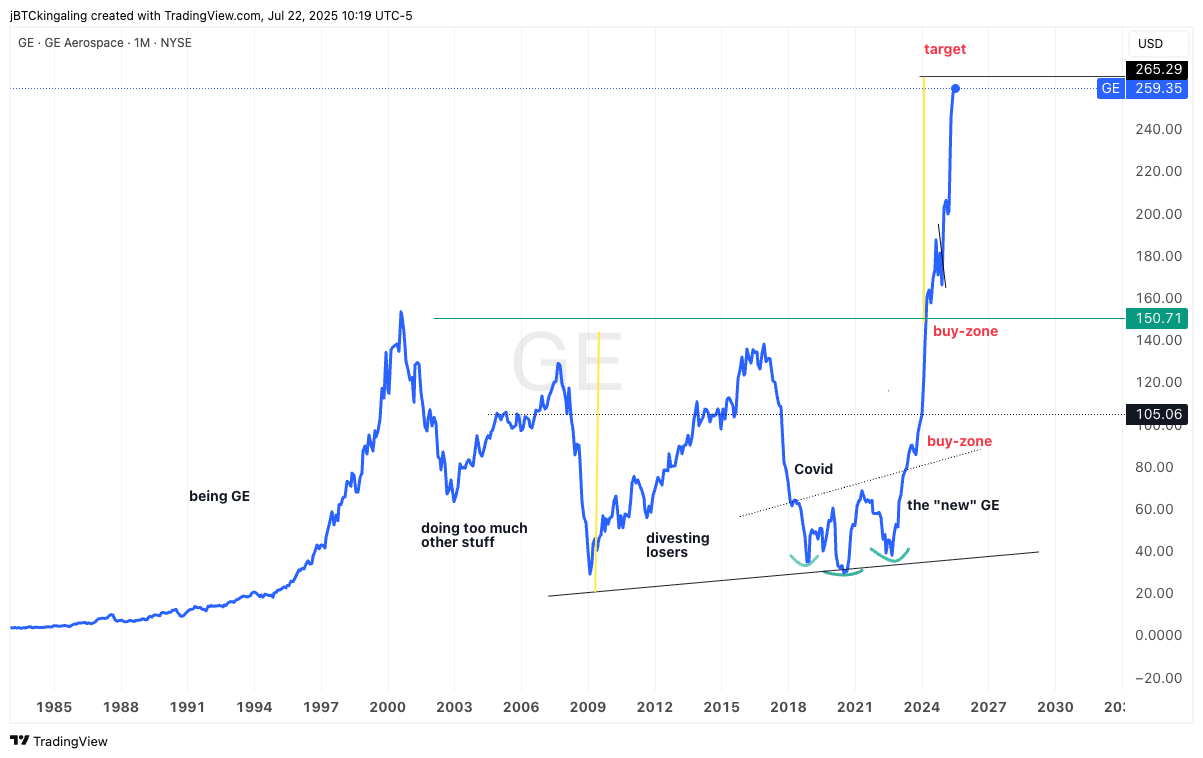
One year ago, July 2024 – ChartWizards Report #53 highlighted General Electric (GE) at $150 per share, breaking out from a 25 year range and with a price target more than 30% higher. That move just happened.
G.E. was one of the first twelve companies to go public on the U.S. Dow Jones Index, in the late 1800s
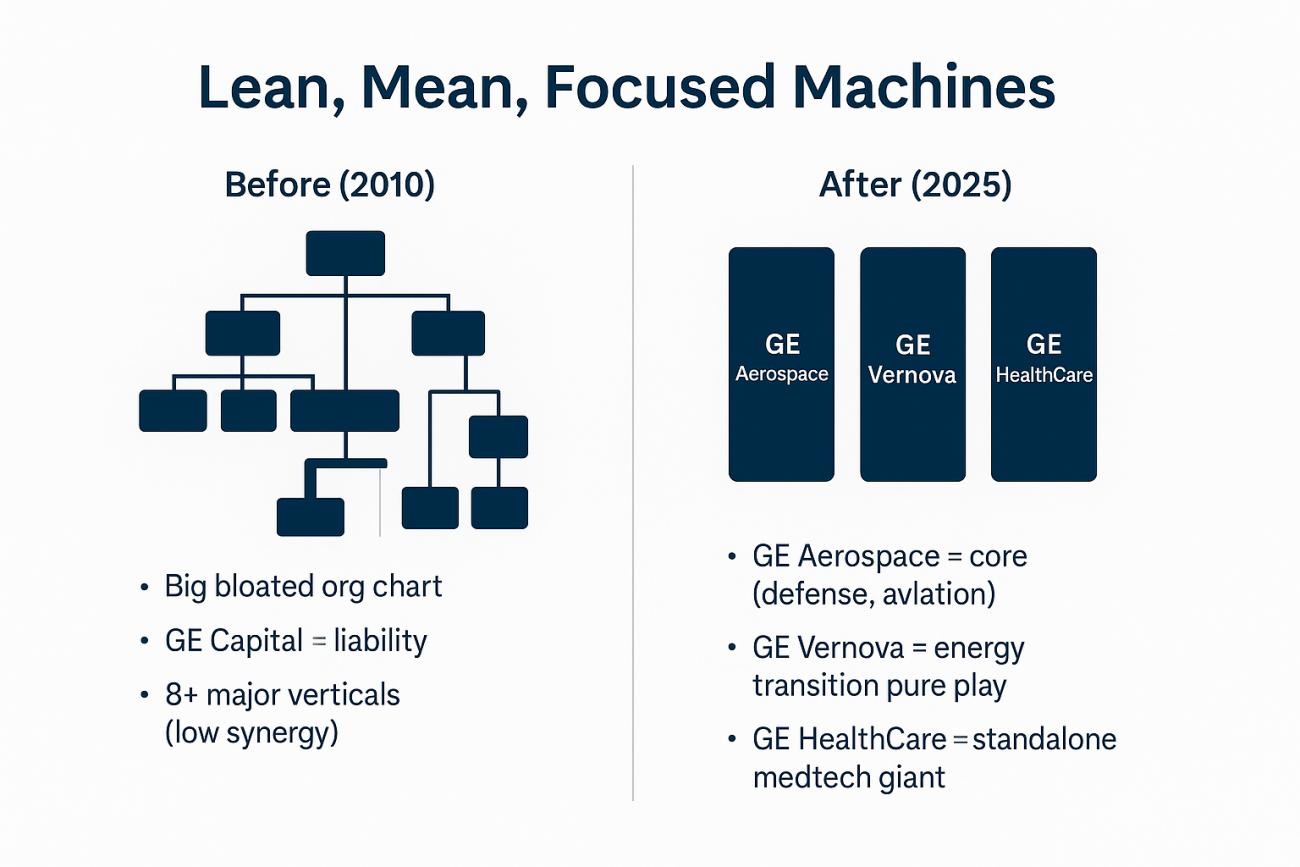
It became an American blue chip, but G.E. peaked in 1999 and spent the next two decades in decline; “doing too much”, diversifying into mediocrity.
Post-2020, we saw an inverted Head and Shoulders bottom nested within a broader structural pivot – the company was divesting losers, leaning back into core aerospace.
The breakout above ~$150 was clear, decisive, and confirmed on both log and arithmetic charts (see Report #53, July 2024)
The measured move objective of ~$260 was derived from Edwards & Magee-style target projection using the depth of the pattern
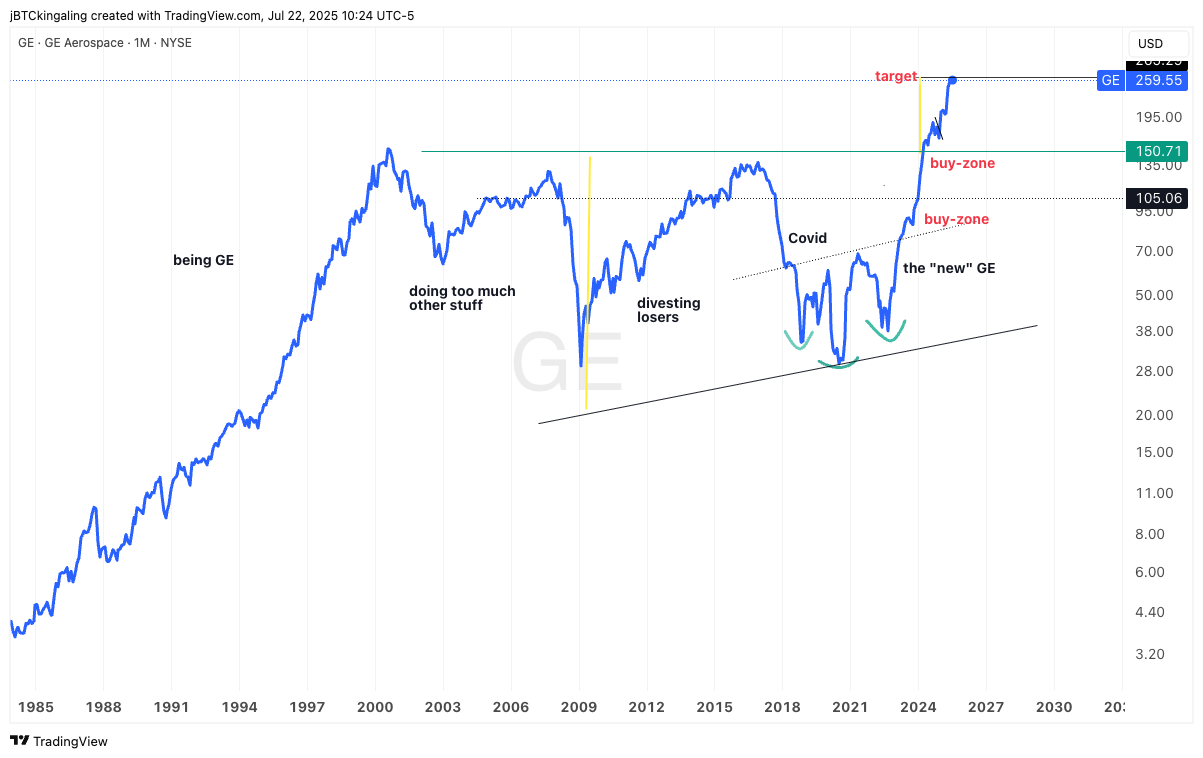
The log chart looks as if the move from $150 to $265 isn’t huge, but it is!
The real alpha in avoiding GE’s 20-year sideways slog (2000–2020) was opportunity cost management. Here’s how I think about it:
From 2000 to 2020, GE:
Lost 75%+ of its peak market cap 😱
Flatlined while the S&P 500 tripled 😩
Burned two decades of investor “patience” ⏳
Avoiding this sinkhole means your capital was free to ride Apple, Amazon, Tesla, ten years of Bitcoin, or any of the other 10x moves in energy, cloud, semis, or healthcare. That’s the alpha of trend following, classical charting techniques, and risk management.
I will NEVER hold a position that digs into my pocket and/or drags down my returns.
The range was long. The breakout was obvious. The post-split restructuring was public. You didn’t have to guess the bottom. You could have read Report #53 while drinking your coffee on a Saturday, and still caught the entire move.
This is enhanced participation, that is avoiding the drag without missing the meat of the move.
Avoiding GE during the dead years was financially beneficial, but it also kept your mental capital fresh and ready for better setups.
In nailing this breakout, we dodged two decades of drawdown disguised as dividend yield. A masterclass in discretion and discipline.
Traditional financial advisors will not give you this edge. They are trained to avoid specificity and hedge their views – speaking in abstractions instead of clean, well-defined setups with asymmetric risk and reward. They don’t say “30-50% upside.” They say “potential for long-term growth.” That’s the difference between asset gathering and actual trading.
At Factor Research, and in ChartWizards reports, trading education is based on the charting principles of Peter Brandt, rooted in the techniques of Edwards, Magee, and Schabacker. No noise, no hype, just disciplined risk management combined with decades of pattern recognition.
Clean technical setups
Macro and structural context (GE’s transformation)
Precise risk-reward framing
That’s what made this GE trade possible.
The entire Report #54 from AUGUST 2024 is pasted below. Its insightful for me to read what I was thinking this time last year, examining where prices were, where my P&L was, where Bitcoin was, etc., and I encourage other traders to maintain their records in a similar way.
This is my third “thought piece” for July 2025, so my apologies for feeling “wordy”, and thank you for reading.
Trade safely.
#jk
 Loading...

Friends of Factor, Chart Wizards, and Aspiring Chart Wizards,
In anticipation of releasing the June 2025 Chart Wizards report in the next few days, I present to you this gift: ChartWizardsNFT™ Report #65 (below) is my most complete, candid, and chart-packed breakdown yet. It covers everything from gold’s moonshot to Palantir’s political premium, plus the impact of Trump’s “Big Beautiful Bill.”
If you trade with conviction, manage risk like a pro (or hope to), and want raw alpha instead of recycled headlines, this report is for you.
Get next month’s setups, breakdowns, and battle tested frameworks before the free crowd.
Factor members get a special discount.
Trade Safe,
jk
Greetings, fellow Chart Wizards, future pros, wanna-be’s, and the chart curious,
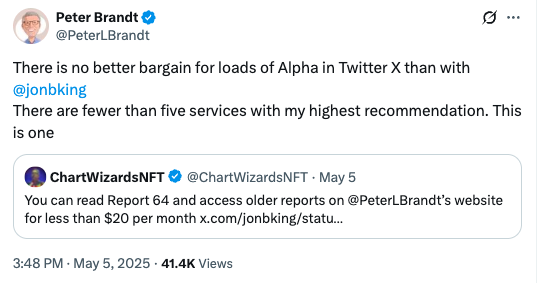
I’m thankful to call Peter Brandt my friend, but seeing as he’s one of the greatest market tacticians of all time, I’m still humbled and honored when he gives me a compliment like this one:
Markets are changing fast, and I wanted to share some FREE alpha with Peter’s readers and Factor members:
My reports aim to distill the most important market-moving news and highlight both new and existing trade setups in a simple, quick, and easy-to-digest format. Most importantly, everything is framed through the lens of risk management, with a focus on practical, tactical trading.
In short, this is my monthly trading journal. It’s never financial advice (I’m wrong a lot). Do your own research (DYOR) before investing capital.
Note: some full pages and select charts have been removed due to their proprietary nature.
Here is a compelling conversation from Dr. Eric Schmidt, former Google CEO, on the intersection of artificial intelligence, biotechnology, and national security.
According to Schmidt AI is “underhyped“. He says it is no longer just advancing computer science and automation, but also reshaping fields like biophysics and materials science. This remark jumped out at me: “The computers are now doing self-improvement… They don’t have to listen to us anymore.”
As markets digest the first U.S. GDP contraction since 2022, a shifting global order is becoming undeniable. A joint U.S.-Ukraine minerals fund, record-breaking container cancellations from China, and rising tariff-driven inflation suggest structural decoupling is no longer just a tail risk – it’s base case.
Fed Chair Powell acknowledged stagflationary pressures and trimmed balance sheet runoff, while Bitcoin dominance and gold prices surged as investors brace for a liquidity pivot.
Meanwhile, OpenAI secured $40B, led by SoftBank, with Trump administration support—marking the largest private tech raise in history. What happens next depends on the Fed, tariffs, and investor resilience.
FactSet: In aggregate, companies are reporting earnings that are 10.0% above estimates, which is above the 5-year average of 8.8% and above the 10-year average of 6.9%.
Torsten Slok at Apollo poured cold water on hopes of getting trade deals done in a timely manner.

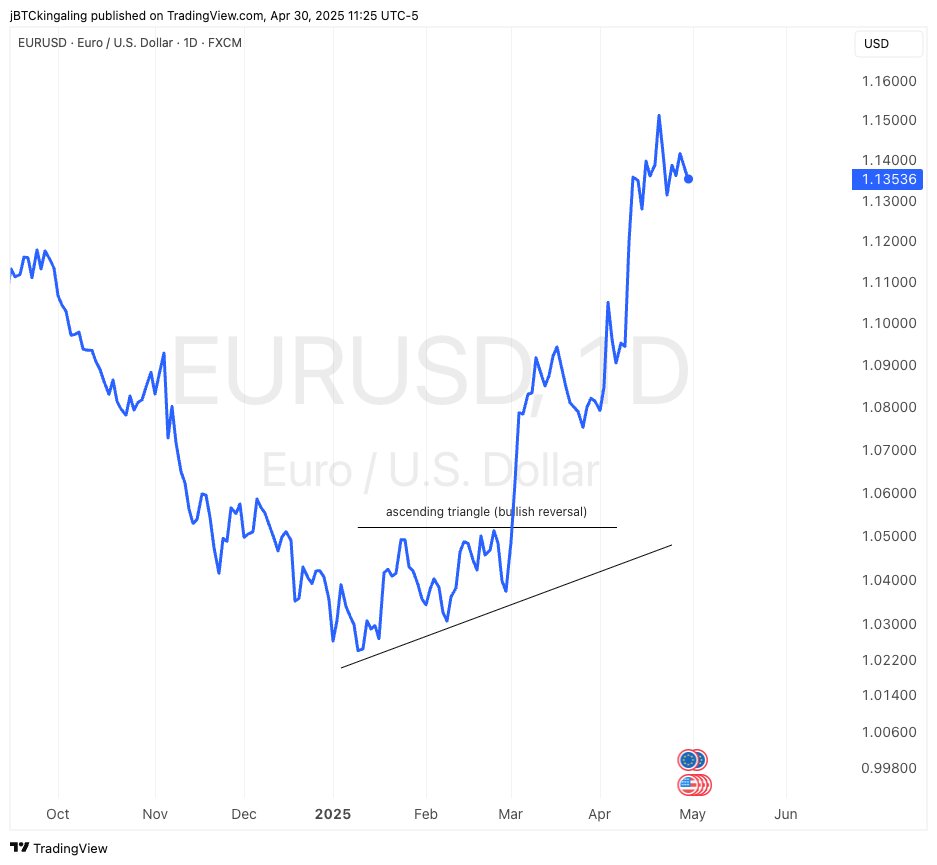
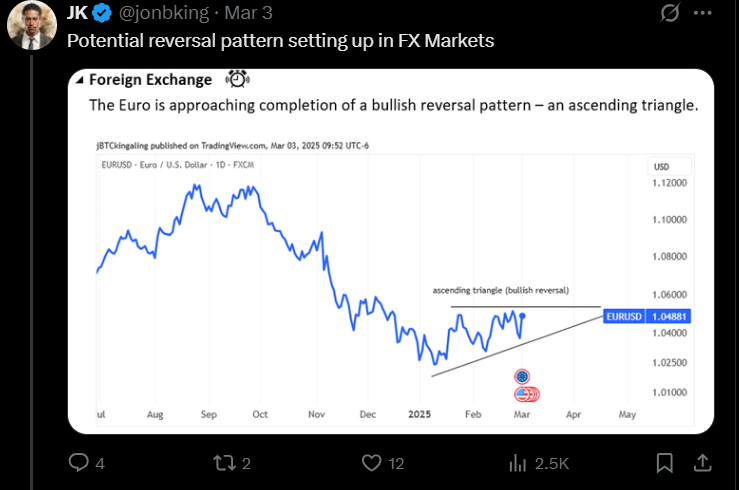
The U.S. dollar’s global share of global FX reserves has dropped from 72% in 2000 to 58% today. The USD is still dominant, contributing to about 50% of global transactions; however, investors are diversifying away from USD exposure amid rising tariffs and political volatility. In contrast, EURUSD broke out of its multi-month base as Eurozone GDP surprised to the upside while U.S. growth turned negative. The dollar’s relative strength narrative is cracking under the weight of structural trade shifts, fiscal imbalances, and softer Fed guidance. Expect continued capital flows into alternatives as BRICS currencies and gold gain reserve share.
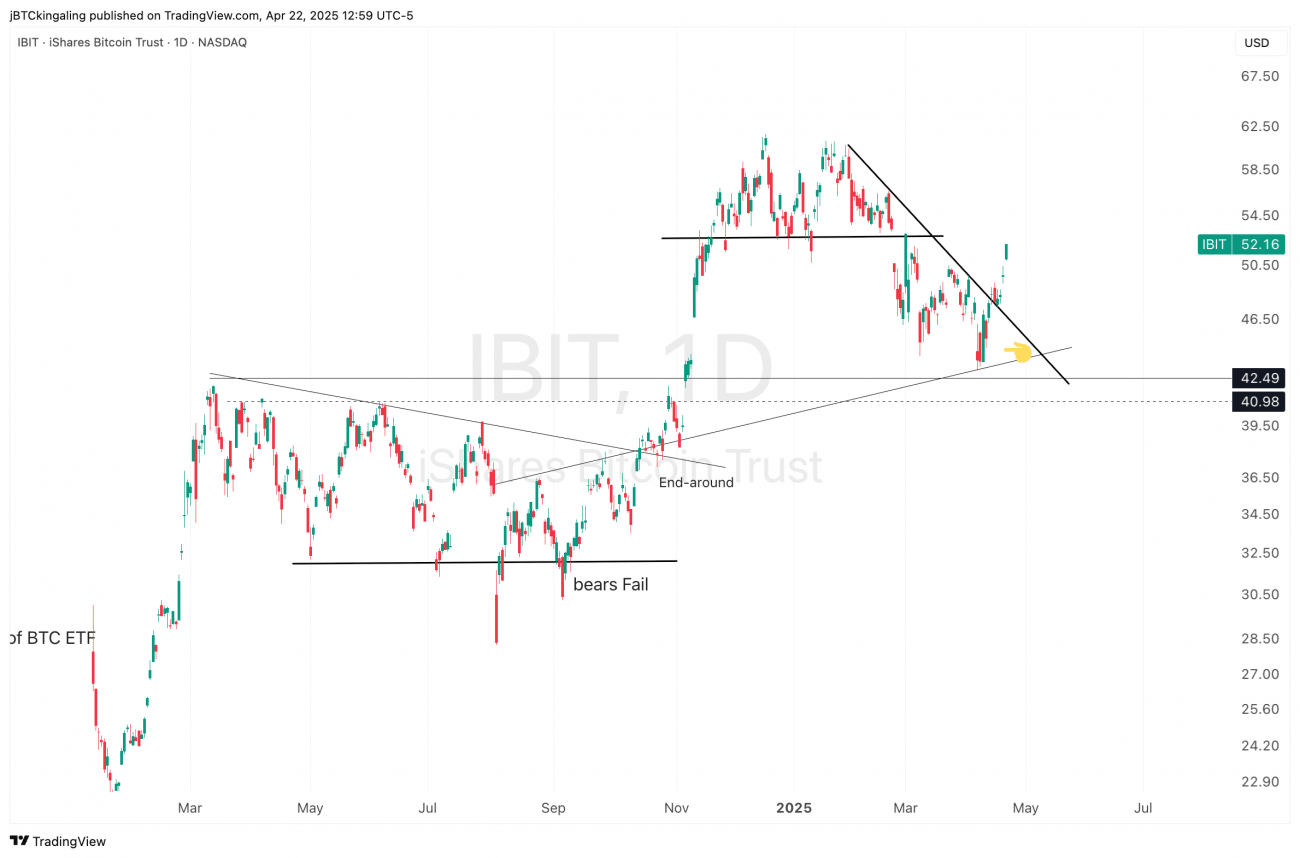
Bitcoin Now Positive YTD, Reclaims Key Level as Institutional Demand Surges
Bitcoin jumped to $94.7k following optimism around tariff de-escalation between the U.S. and China, reclaiming the Short-Term Holder (STH) Average Cost Basis of $92.9k – a critical on-chain pivot historically separating bearish corrections from bullish recoveries.
Institutions Choose Bitcoin Over Ethereum
U.S. spot Bitcoin ETFs saw a record $1.54B in net inflows on April 22, dwarfing Ethereum ETF flows, which remain below 1% of spot volume. This reflects a widening institutional preference for BTC, reinforced by macro uncertainty and clear digital gold narratives. For Bitcoin, reclaiming and holding the STH-Cost Basis is pivotal. If this level holds, it could mark the transition to a sustained bullish regime. If not, recent gains risk being another dead cat bounce in a still-fragile macro backdrop.
-JK
SAMPLE_May 5 2025 CWNFT 64_JK
Dalio again showcases his ability to break down complex ideas into clear, digestible insights. In this 40-minute summary of his latest book, he explains how studying history provides a framework for understanding the future, recounts being on the stock market floor the day after President Nixon took the U.S. off the gold standard, and discusses how growing gaps in incomes and values is reshaping society in today's world resembling the period from 1930 - 1945.
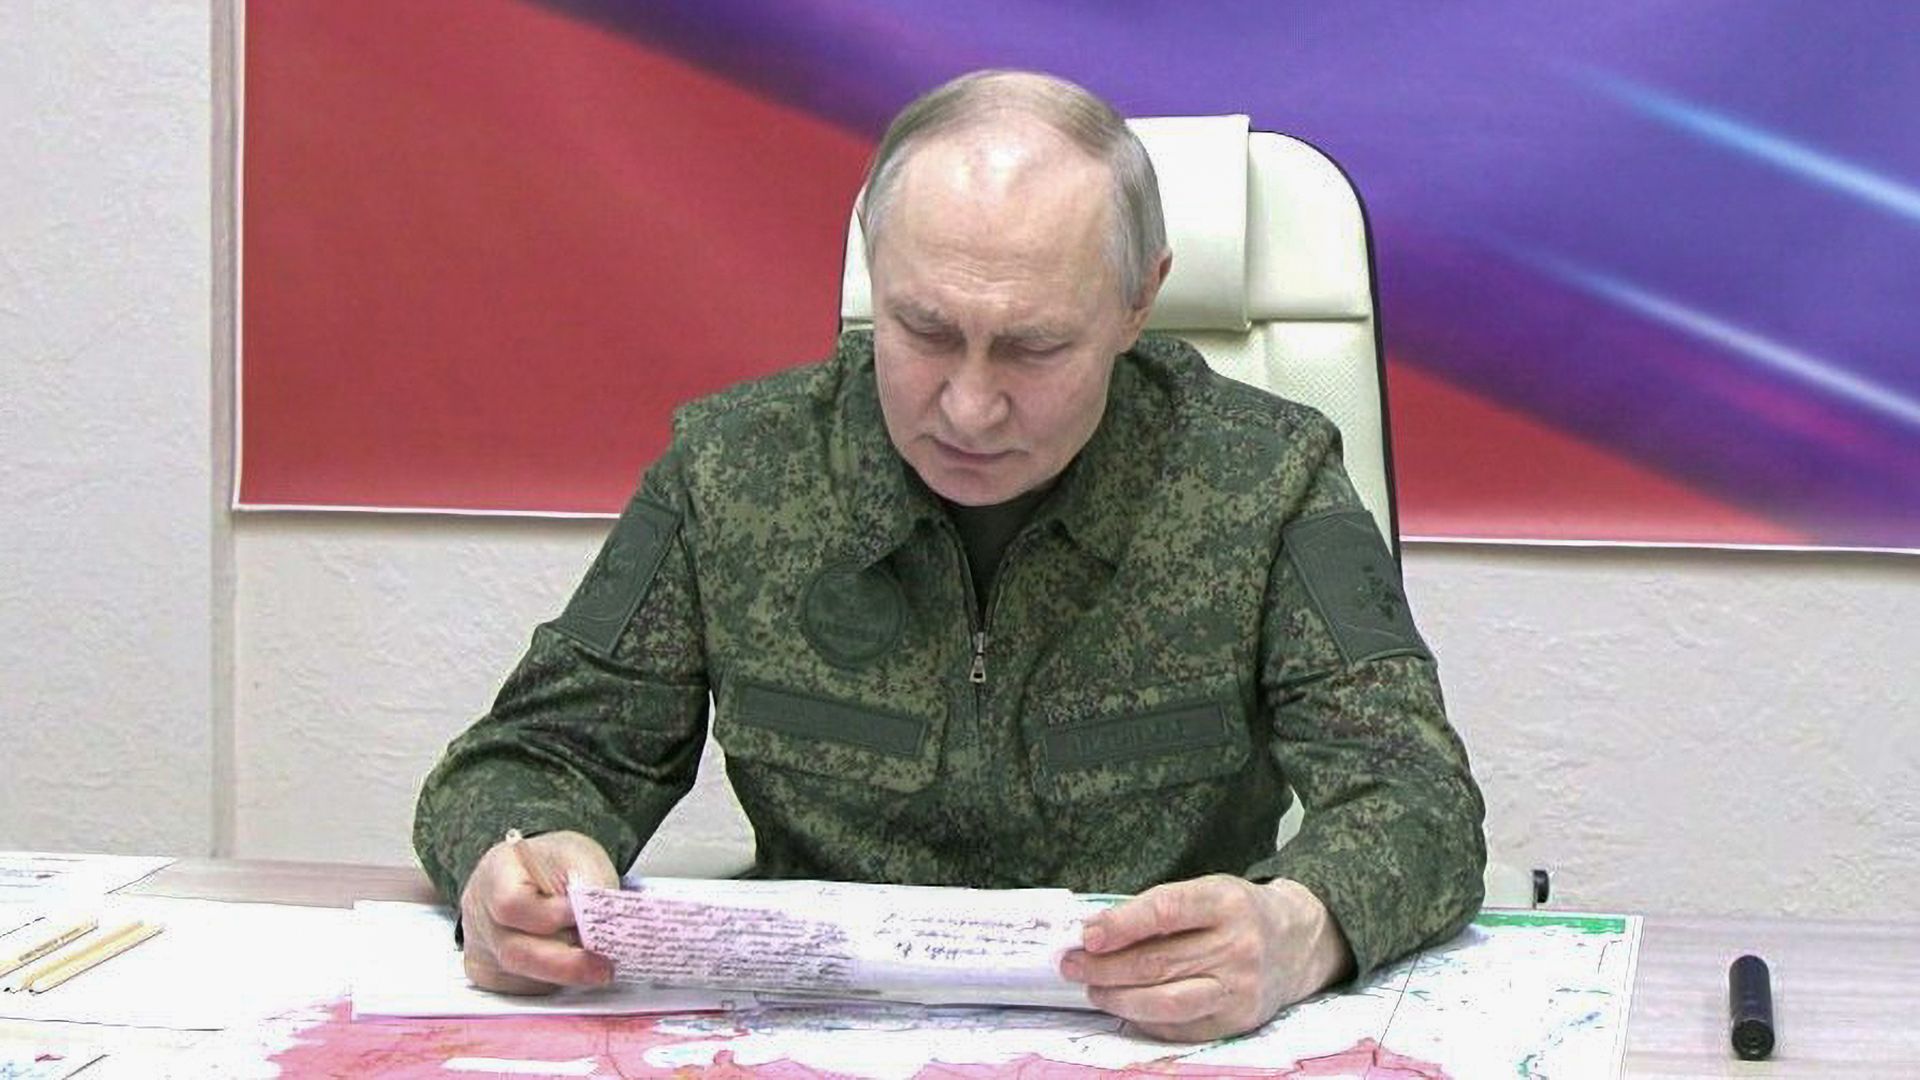 Ushakov reiterated these demands: Ukraine must recognize Russia's annexation of Crimea and four southeastern regions, withdraw troops from lands claimed by Russia and pledge never to join NATO. He said he "hopes [the United States] knows our position and wants to believe that they will take it into account as we work together going forward."
The U.S. restored military aid to Ukraine after ceasefire talks this week in Saudi Arabia.
Ushakov reiterated these demands: Ukraine must recognize Russia's annexation of Crimea and four southeastern regions, withdraw troops from lands claimed by Russia and pledge never to join NATO. He said he "hopes [the United States] knows our position and wants to believe that they will take it into account as we work together going forward."
The U.S. restored military aid to Ukraine after ceasefire talks this week in Saudi Arabia.
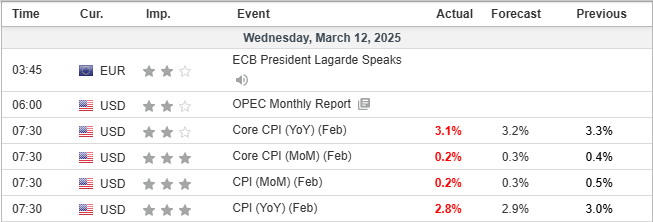
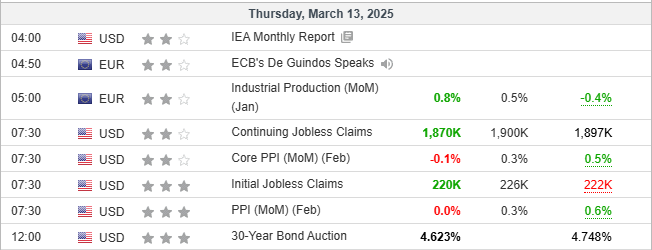 “February’s CPI report flags weakening consumer demand for discretionary items, echoing the pullback in spending evident in other data. But disinflation in certain goods that are highly exposed to tariffs – cars, home furnishings, apparels – has stalled." - Bloomberg Economics
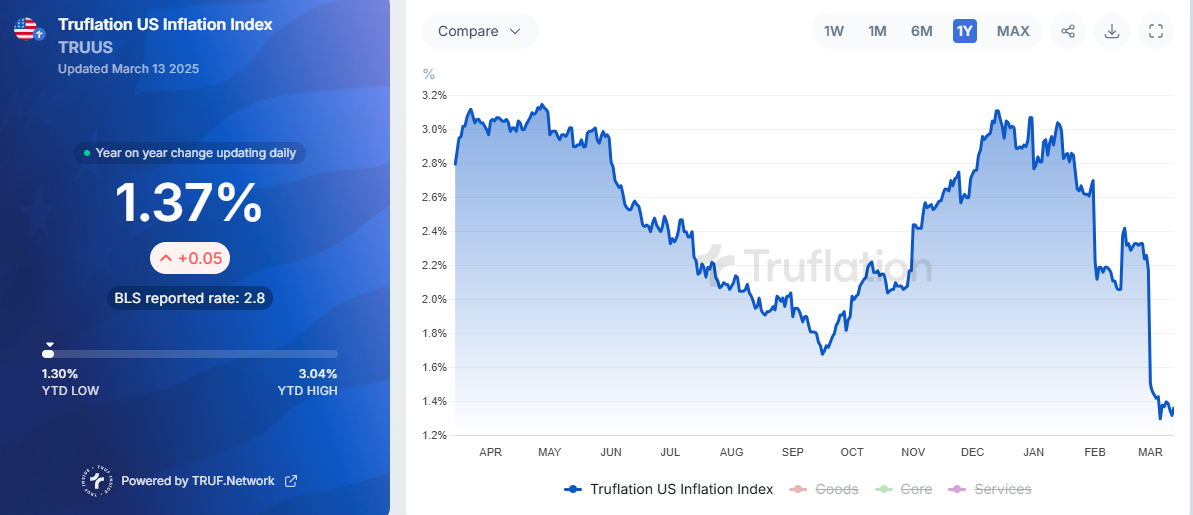
Truflation
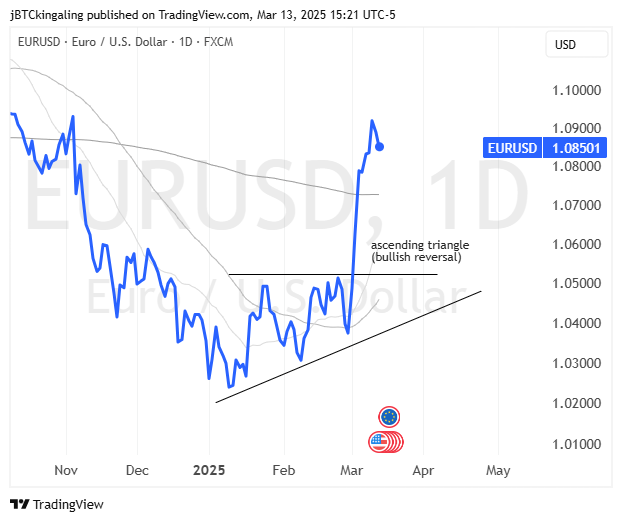
Days before, taken from Chart Wizards Report #62 and X post.
Oil Market Update: Optimism vs. Reality
Houston’s annual oil and gas conference was buzzing with optimism under a pro-fossil fuel Trump administration, but major oil traders, including Vitol and Gunvor, are beginning to turn cautious on crude prices. Welcome to the dark side.
Vitol and Gunvor don't expect an oil price crash, but instead a slow grind lower as supply outpaces demand. OPEC+ is ramping up production, U.S. output remains steady (though slower than before), and South American supply is growing—all adding downward pressure on prices.
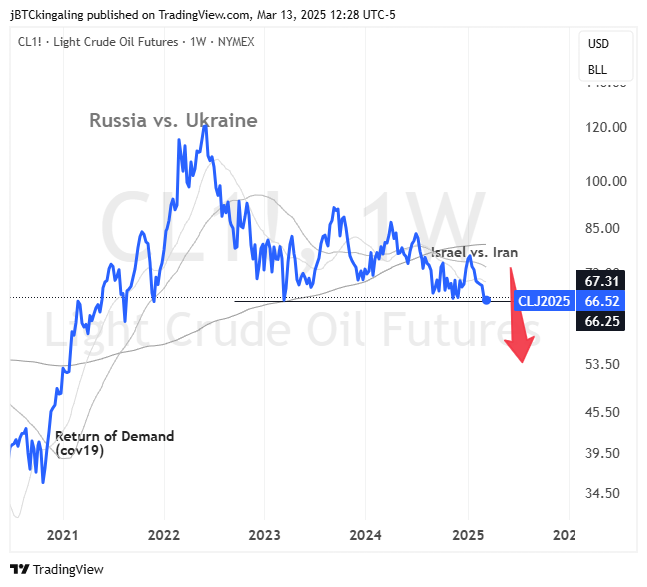
crude oil futures (continuous) $/bbl
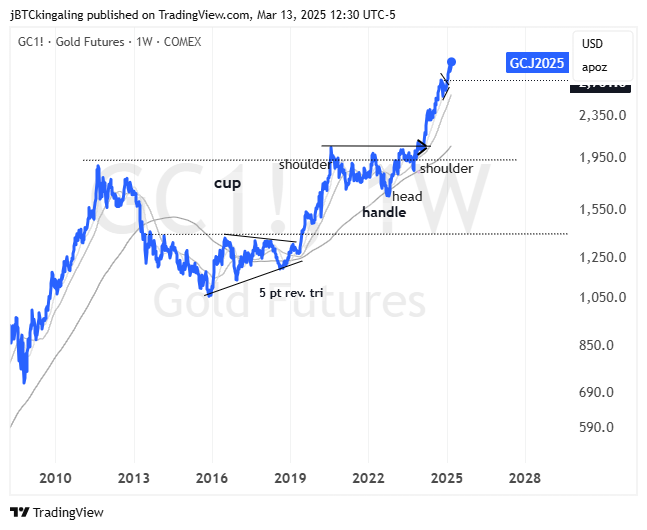
Gold futures $/oz
London vs. New York Gold Markets:
Recent Developments:
Market Impact:
Price Structure Shift:
Risk Management & Strategy:
 https://www.youtube.com/watch?v=jvxQJBQidy4&t=1s
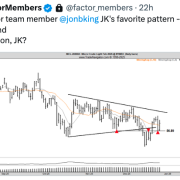
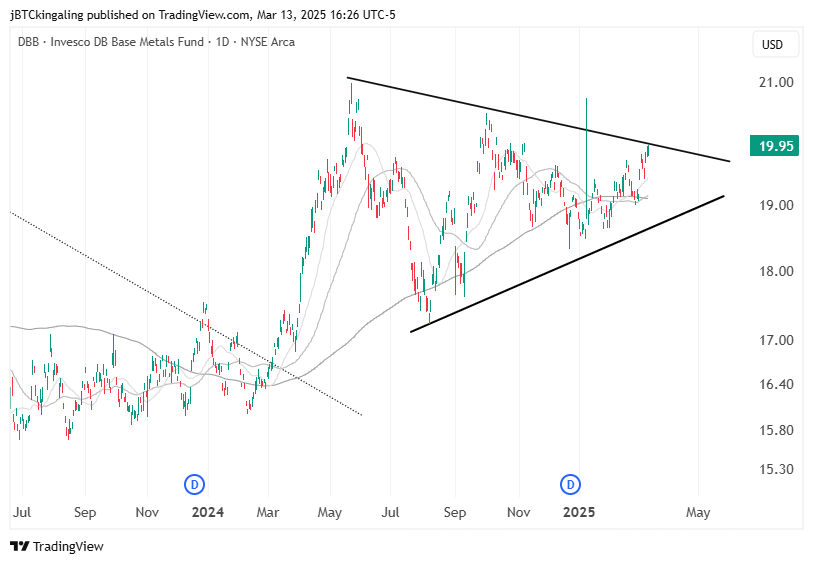
 Check out this symmetrical triangle in $DBB - Invesco Base Metals ETF. Diagonal boundaries are not ideal. See previous Peter Brandt posts on horizontal vs. diagonal boundaries.
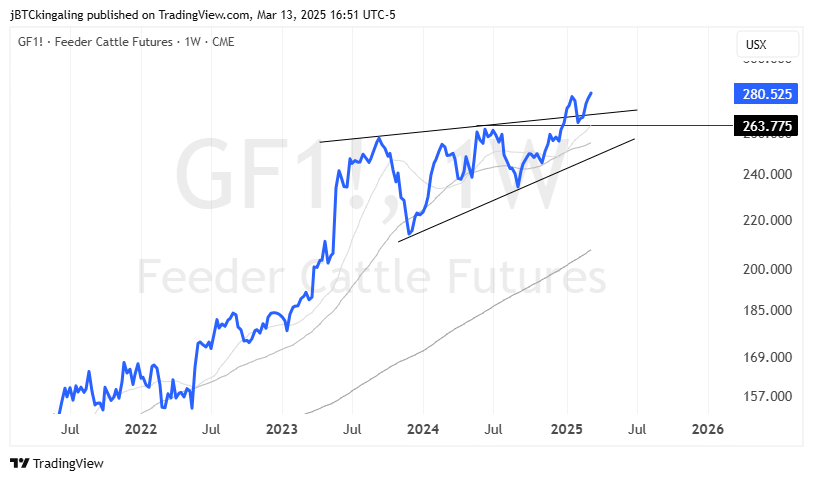
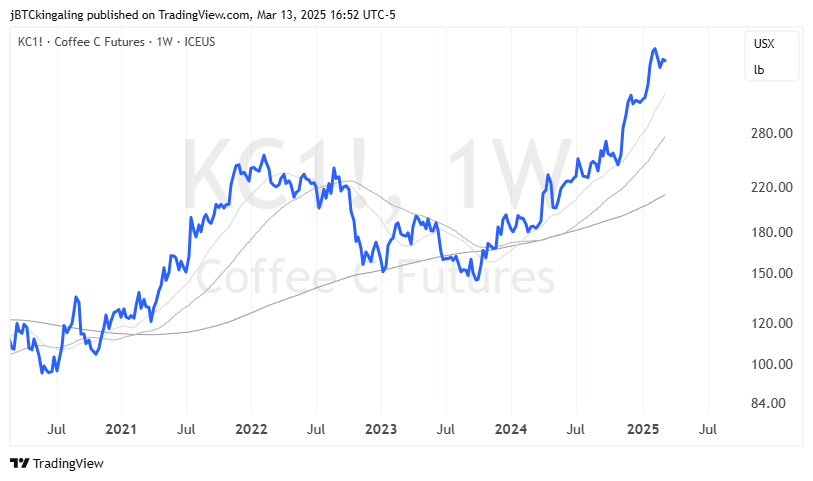
 🔹 Other Strong Commodities Trends 🔹
Cattle & Coffee - new all-time highs for both in recent weeks, and both look to continue the upward momentum on rising costs and worsening supply.
🔹 Other Strong Commodities Trends 🔹
Cattle & Coffee - new all-time highs for both in recent weeks, and both look to continue the upward momentum on rising costs and worsening supply.
 For astute investors, long-term investors, and students of history, we're in the midst of what is likely a generational buying opportunity. In times like this, I look to my friend Peter for wisdom. Peter has traded actively through FIVE DECADES🐐 .
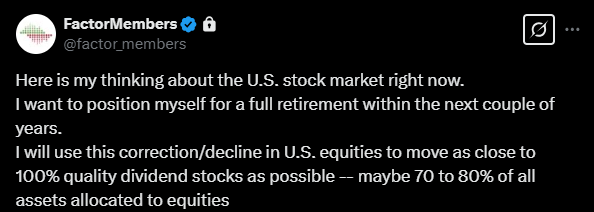 I have a simple approach when it comes to my long-term portfolio:
 And on that note, let's get back to the charts.
Relative strength is a great way to discover alpha during broad market corrections, and I'm looking at several stock charts for new positions. I am flat most of these today but have alerts and orders resting in the system.
And on that note, let's get back to the charts.
Relative strength is a great way to discover alpha during broad market corrections, and I'm looking at several stock charts for new positions. I am flat most of these today but have alerts and orders resting in the system.
... To be continued for Chart Wizards subscribers...
Read More
🚀 Free Preview: Q1 2025 Review & Outlook Report (#62) 🚀
Exclusive insights from ChartWizardsNFT, released March 3, 2025, for Peter Brandt’s subscribers.
📉 Markets are shifting fast. Are you prepared? 📈
💡 Subscribe today for less than $20/month and gain full access to monthly macro & tactical trading reports.
🔗 Join now → HERE.
PREVIEW_CW62_Q12025_JK
![]()