Commodity prices are topping now!
This content is for members only
The Public Blog site
Bear flag retest of diamond top is turning down
Two chart observations are worthy of note on the nearby daily futures graph. First, the decline in early May completed a 4+ month diamond top. This is a major reversal pattern. Second, the rally from the May 12 low is tracing out a bear flag. The decline today may indicate that the May 31 high will be the high of the flag.

The weekly chart of JJC, the Copper ETF, shows that the dominant trendline from the late 2008 bottom has been violated. Keep in mind, the violation of a bull trendline is not, in and of itself, a bearish signal. It does recognize that a trend change is in the process of developing.

###
It’s the line that counts.
Every thing else is noise and clatter intended to confuse and separate traders from their money. Where a market closes is all that matters.


My final thought for the weekend.
###
I plead with all you newcomers to trading, please don’t get caught in this trap.
Trading is hard work. There are no short cuts. Tuition is required, and the markets decide the amount of the tuition.

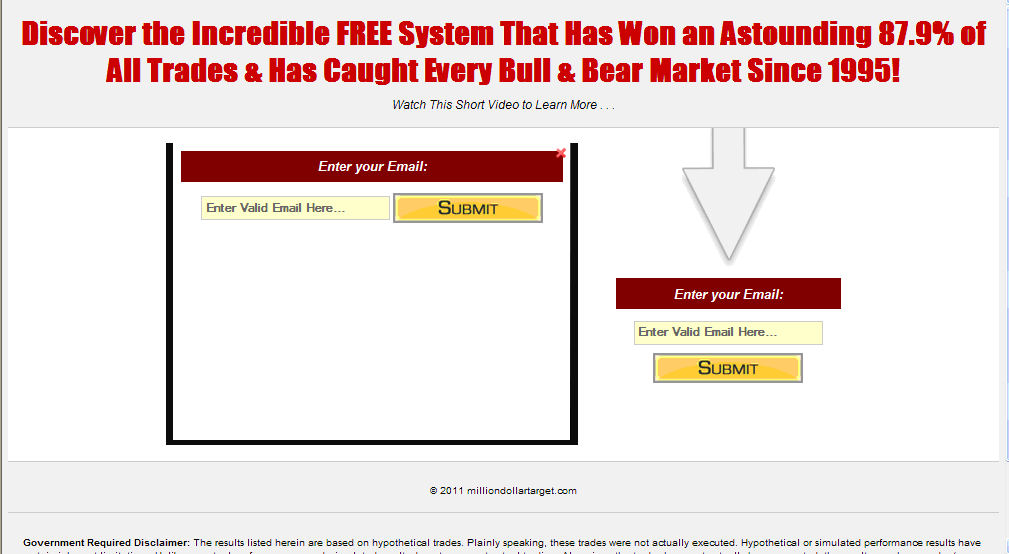
Yet, every year thousands of newcomers to trading get trapped by con artists such as the people behind this email ad. There is no such thing as a trading system that is accurate 88% of the time.
Enter scams such as this at your own risk.
P.S. The bottom of the ad, in tiny print, contains the sentence, “These trades were not actually executed.” That tells it all.
###
Yesterday morning I posted “Lessons from a difficult year of trading.” The post detailed three major factors contributing to my current 13 percent drawdown and nine modifications I am making to my trading plan in response to the situation. All successful traders – discretionary and systematic – are constantly on the alert for ways to improve their trading operations.
One of the nine modifications was the following:
Modify my protective stop protocol to reflect increased intraday noise
I have always believed in having protective stop orders in place at all times. I am no longer a strong advocate for this practice. I have been stopped out of too many positions only to see better exit spots within hours or days. Rather, I am now an advocate of the following protective stop protocol.
My friend and peer, Robert Sinn at The Stock Sage responded to my post almost immediately with an excellent piece titled, “The Evolution of a Professional Trader – Stop Loss or No Stop Loss?” Read Robert’s post here.

Robert Sinn, The Stock Sage
Robert is one smart trader and seldom misses a beat. Robert, very wisely, makes the following point:
“I believe that the use of stops is absolutely essential in short term trading. A trade should have a defined target objective which in turn requires a defined risk. It is too easy to talk oneself into moving a mental stop in the middle of a trade, therefore, using a hard stop (placed shortly after the trade is entered) is optimal over the long run.”
In a subsequent back-and-forth email exchange, Robert suggested that I more fully explain the thinking behind this modification. Great suggestion! So, here it goes.
Stops are essential in trading. Novice and emerging traders should NEVER trade without a protective stop. NEVER! I agree with Robert that using a hard stop is optimal over the long run.
The modification I am making is a rather nuanced one, as I will explain with three points and a chart example.
First, it is important for you to know that I seldom trade a leveraged futures or forex position (although the total value of all my positions combined at any given time will exceed my account value). For example, for each $1,000,000 of account value I am likely to limit a trade to four contracts of Comex Gold, 300,000 to 400,000 EURUSD or ten contracts of Corn, just to provide a few examples.
Second, I traded for decades when overnight markets were not even available – and my performance during those years was actually superior to my performance since 24-hour markets began. I can remember being awakened in northern Minnesota in the middle of a summer night by a thunder bolt, and wondering, “Is it raining in central Illinois…how will Beans open tomorrow?” I begin trading spot forex in the early 1980s, but did not pay any attention to overnight cross rates (except for the Yen) until 2007. I was in the Crude Oil market at the start of the Gulf War. I was in a Gold position on 9/11 when the Towers were hit. I survived these events just fine without 24-hour markets.
Sure, not having an order in the overnight markets will result in an occasional hit. But, I am convinced that the risk is worth it – especially considering the fact I am not leveraged in any given market.
Third, my focus on closing prices is very consistent with orders that were once common place in the good-old days of the exchange trading floor. The electronic exchange has taken flexibility away from traders. How unfortunate! For example, one order I used extensively was an “OCO,” or “one cancels the other” stop, with one component being a hard stop and other component being a “close-only” stop. Here is a real example of how this would have worked in a recent trade.
I shorted the June S&Ps at 1323 on May 17. I always place protective stops a few points above the high of the bar I use to protect a trade. The bar I used for the stop was the May 16 bar, which had a high of 1341.25. My stop was placed at 1343.25. I was stopped out on May 19.

However, my preferred order would have been to place a “close-only” stop against the May 16 bar and a hard stop against the May 13 bar. In the good-old days my stop-loss order would have read…
This order strategy would have kept me in the trade. In a very real sense, this modification of my protective stop strategy is a roll-back to earlier days intended to nullify intraday noise. I will lose more money in those trades in which I am dead wrong on direction, but I will keep from getting chopped up in many more trades.
Yet, I completely agree with StockSage1 in principle that the use of stop-loss orders, all other things being equal, is a must in trading.
###
This correspondence details lessons I have learned about myself, my trading and the markets as a result of a difficult year of trading.
Perhaps these lessons can benefit you, especially if you are a discretionary trader who uses chart patterns for trading.
I am not shy about hyping my good trades. I am also not hesitant to point out my unprofitable trades as well. In fact, traders who know me best would say that I am much more inclined to discuss my struggles than my victories in trading.
Touting only profitable trades is a violation of full disclosure because profitable trades are not representative of overall trading performance. On the other hand, an analysis and discussion of the trials and tribulations of trading can produce trading insight. In fact, I believe that the best thinking by traders occur during periods of adversity. It is during these periods that traders think most deeply about their trading and risk management protocols and practices, about market behavior and about the human dimension of market speculation.
I am presently experiencing a quite unpleasant 12-month period in the markets. It has been Chinese water torture. I have been forced to go back to the drawing board to re-examine every aspect of my trading.
Background
First, some perspective is in order.
Coming into 2010, I had three pretty good years of trading. In 2007, my trading account gained 95 percent (due mostly to Gold). I was up 59 percent in 2008 (EURUSD and GBPUSD). Then, 2009 was an okay year with a 24-percent gain (due almost exclusively to a mid-year Sugar move). I had a fair first four months in 2009, up about 7 percent, but trading has been a struggle since then. I am in a 12-month drawdown of around 13 percent. The peak-to-valley magnitude of this drawdown (marked by red box) has been mild by historical standards, but the duration has been a 30-year record. The scatter graph below displays all my drawdowns in excess of 10 percent.

I have had some excellent trades in the past 12 months, but they have been too few and far between. As I stated earlier in this correspondence, this past year has been like Chinese water torture…drip…drip…drip! Of all the drawdowns I have encountered over the years, this one has without a doubt been the emotionally toughest to endure.
Since 1981 I have experienced more drawdowns than I can remember – at least two in excess of 5 percent every year I have traded. I have survived every drawdown. I have no doubt I will survive this drawdown – and that I will emerge as a better trader.
As has always been the case with drawdown periods, I attempt to ask (and hopefully answer) three questions.
1. Has my trading plan/guidelines/rules been out of synch with the markets?
2. Has the basic behavior of the markets changed?
3. Has my trading execution been out of synch with the plan? (Note: this applies more to discretionary traders than to systematic traders.)
As I analyzed the past year, the answers to the three questions are YES, YES, and YES. My analysis attributes a percentage contribution to trading results by each item. Perhaps in a future post I will address the attribution analysis.
Over short periods of time nothing can really be done to address #1. All trading plans are cyclical in terms of their alignment with market action. Addressing foundational flaws of a trading plan is an ongoing effort for all traders. This is a healthy and needed process.
But a “Yes” answer to item #2 is a more complicated matter. I believe the basic behavior of markets has changed permanently. See my blog post here for my thinking on this matter. Yet, I also believe that my solutions for items #1 and #3 will address the changing nature of the markets.
Action plan
The bottom line issue for me is simple – What changes do I need to make to my trading plan (and the execution of the same) and to my risk management protocols to return my trading plan to consistent profitability? Without going into depth on each item, the following represents my action plan. Some of these items represent modifications, some new twists and some a rededication to basic principles.
Focus on charts from an elevation of 40,000 foot
Daily chart patterns have become increasingly unreliable. In fact, the changing nature of the markets (especially in forex and futures) has almost made shorter-term patterns things to be faded. This means that I will not look at an intraday chart and only look at a daily chart if the weekly or monthly charts have given me a reason to do so. Fortunately, the weekly and monthly charts have not been compromised by changes in shorter-term market behavior.
Decrease risk per trading event
My historical maximum risk per trade has been 100 basis points, with the entire position entered at once. I have readjusted this maximum risk to 60 basis points, with positions being established in halves or thirds.
Avoid range-bound markets
The past year has greatly reinforced the concept of “markets at rest remain at rest and markets on the move remain on the move.” I have lost a significant amount of capital in the past year anticipating breakouts that did not occur.
Be much more aware of the underlying trend
Defining “trend” can be a difficult challenge, but I have begun monitoring some moving averages – not in the sense of developing or using a moving-average trading system, but as a proxy for trend. A majority of the chart pattern trades that have cost me money in the past year have been countertrend (as measured by the moving average proxy).
Transition away from high/low/close bar charts to closing price charts
“Noise” has increased in my primary markets (futures and forex). I have had way too many orders executed at intraday price extremes, only to have the markets close at prices favorable to my trades. The most important price of the day is the closing price. The most important price of the week is Friday’s close.
Modify my protective stop protocol to reflect increased intraday noise
I have always believed in having protective stop orders in place at all times. I am no longer a strong advocate for this practice. I have been stopped out of too many positions only to see better exit spots within hours or days. Rather, I am now an advocate of the following protective stop protocol.
Actively trade a portion of a position
Historically, I have held onto my entire position until the target was reached or until the initial protective stop was hit. This strategy has not treated me well during the past year, and, in fact, has negatively impacted my bottom line for the past two years. Rather, I have adopted a strategy to hold half of a position while trading half of a position, selling only on strength and buying only on weakness.
Avoiding ambiguous market situations
As a discretionary trader (as opposed to a systematic trader), there are always market situations that fall into a grey zone – “is there a set-up or isn’t there a set up?” I have historically erred on the side of giving a set-up the benefit of doubt, believing that I would benefit if just one in four questionable set-ups worked. My theory has been that making money is more important than being right. I have reappraised this trading strategy in favor of demanding more clarity from chart patterns. I still believe that making money is far more important than being right — but with less reliable chart patterns, erring on the side of caution is now part of this belief system.
Limit my decision-making time window
I have long had a rule to determine and enter my orders each afternoon and then avoid exposure to the markets during the trading session. At the same time, I love the markets and, like so many other traders, get caught up in the price-making process. The degree to which real-time decision making has negatively impacted my bottom line really hit home in the past year. I am NOT a good intraday trader – never have been, never will be. Paying attention to the markets during the trading session is detrimental to my financial (and emotional) health.
Another aspect of intraday decision making is worthy of note. There was a time in the markets when the trend of the first several hours would continue through the day. This is no longer the case. Directional price momentum during one time slot seems to have no correlation to momentum in subsequent time slots. Markets now routinely make new highs and lows frequently throughout the day.
Let me close this post with one other thought. I am in a drawdown. Yet, I am in no hurry for a new NAV peak. I have seen too many traders blow-up by “doubling up to catch up.” I can only control what I can control – but profitability during any given time period is not a controllable variable.
That’s it for now, folks.
Often a pattern failure tells a better story than does a pattern completion.
This is just what we have in the case of new crop December Corn. As of last week it appeared that Dec. Corn was forming a H&S top pattern. On Wednesday, May 11, the market completed the top pattern (the “A” in the story). On May 12, the market had a minor upside reversal, but remained below the neckline. On May 13, the market poked back above the neckline intraday, but closed below the neckline. Then on May 16 the market spent the entire day above the neckline, followed by a strong gain on May 17. This is the “B” in the story and confirmation that a bear trap had been sprung.

I consider H&S failure patterns to be very tradable chart developments. The advance today, May 18, penetrated the May 10 right shoulder high and officially completed the failure pattern. This is the “C” in the story. Support should be solid at 664.
The target of 733 is based on projecting the distance between the April 26 high and the May 12 low (which is 69 cents) upward from the right shoulder high of 664. The market should probably not take out Wednesday’s low (652-3/4).
###
![]()
