

Factor Alert, November 16, 2016 — Japanese 10- Yr JGB

Yen Chart – Textbook Market
Yen Chart – Textbook Market
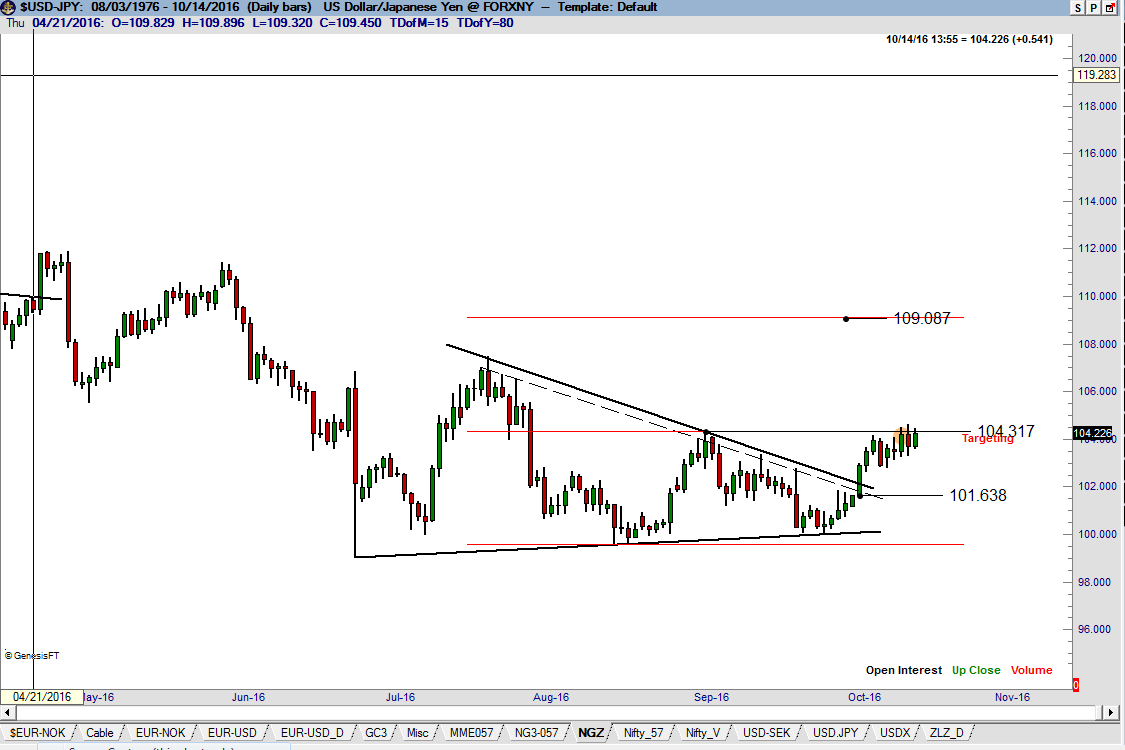
The Yen Chart is a textbook charting market – it has a long history of providing very reliable pattern signals, as shown on the weekly chart dating back to early 2011.
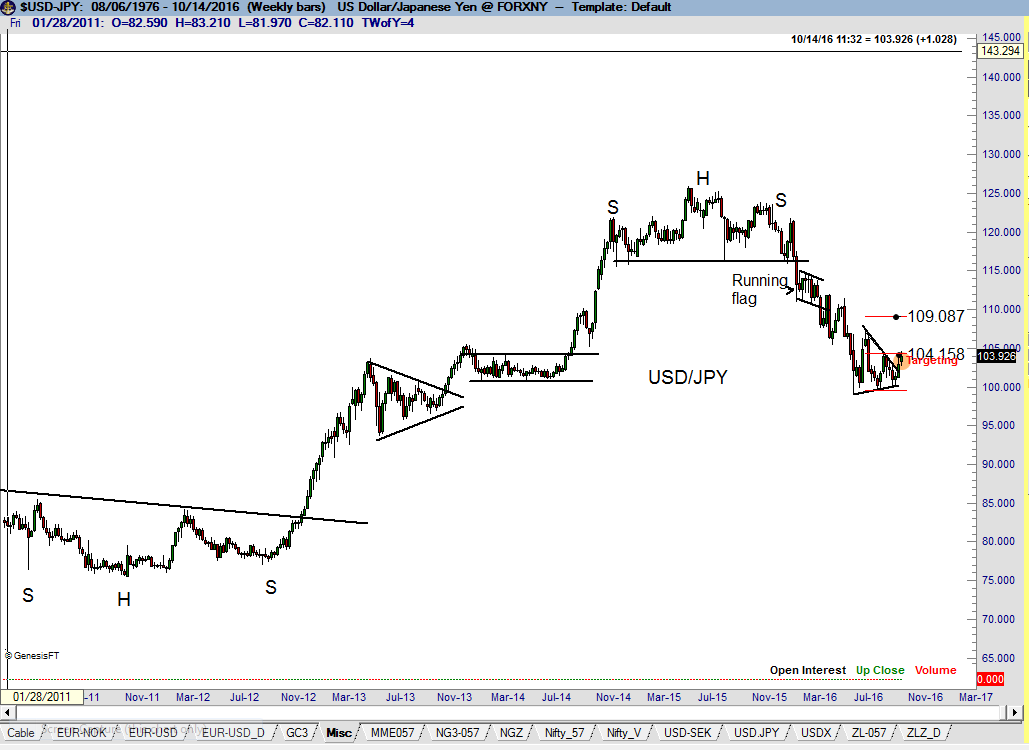
The advance on Oct 4 appears to have completed a possible 16-week symmetrical triangle bottom – remember that the symmetrical triangle pattern is far less reliable than horizontal patterns such as the H&S, rectangle and right angle-triangles. In order to be confirmed, a breakout of a symmetrical triangle bottom needs a decisive close above the last intermediate high in the triangle – marked as point #4 at 104.32 on the daily graph. A confirmed breakout on the Yen Chart would have a minimum target of 109.
.
Factor Membership
Peter Brandt is a 40+ year veteran of trading. Through his Factor Service, members receive:
View your Factor Member options here.
You could consider your membership in the Factor Service as just one more trade. If the Factor Service is not of value to you, well, it is just one more trade that did not work. Through the Factor Service I endeavor to alert novice and aspiring traders to the many pitfalls you will face – and to offer advice on overcoming those pitfalls. My goal is to shoot straight on what trading is all about. For more information watch my 30 minute webinar where we cover the Factor service in depth.
I hope you will consider joining the Factor community.


Japanese Yen Alert

Factor Update, May 1st

Factor Update – April 9th
Factor Update - April 9th
Read More
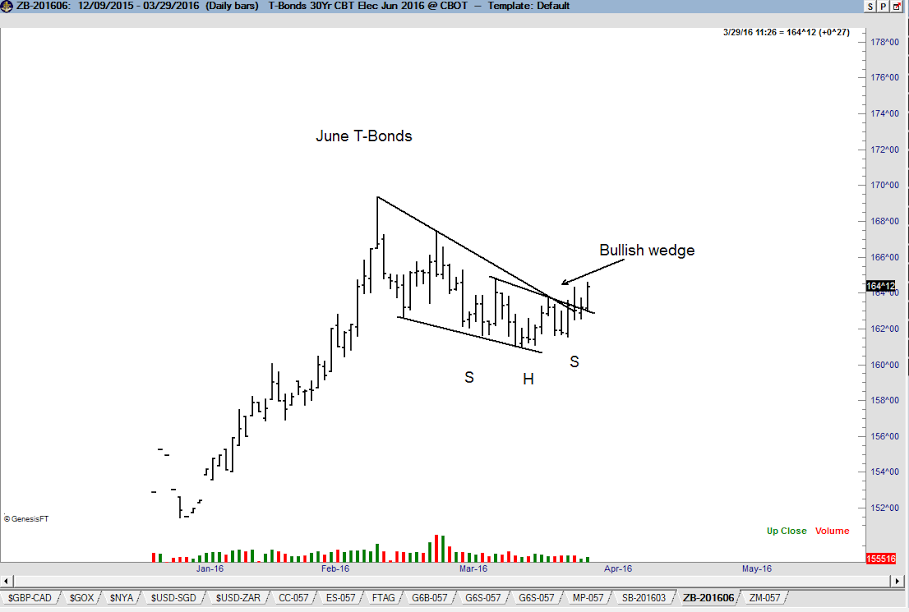
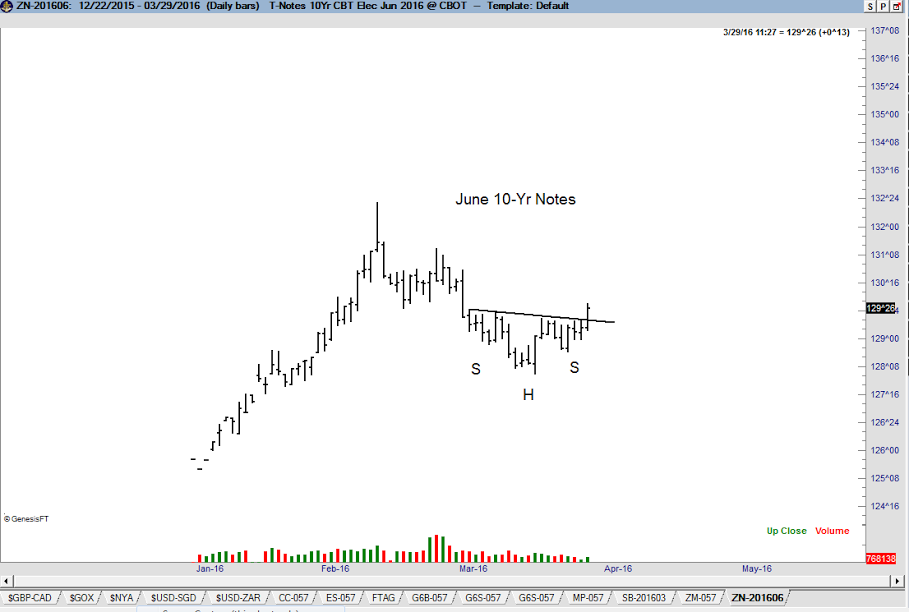
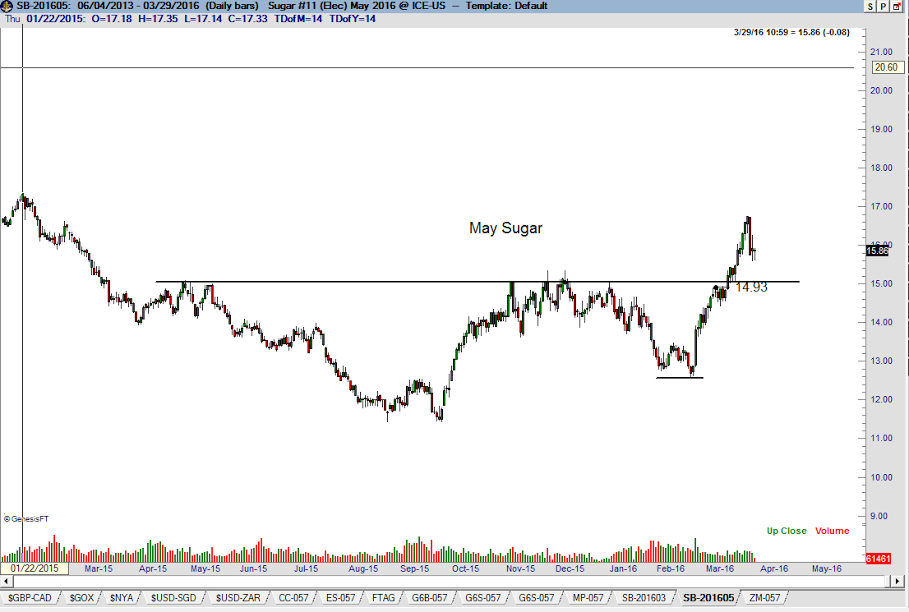
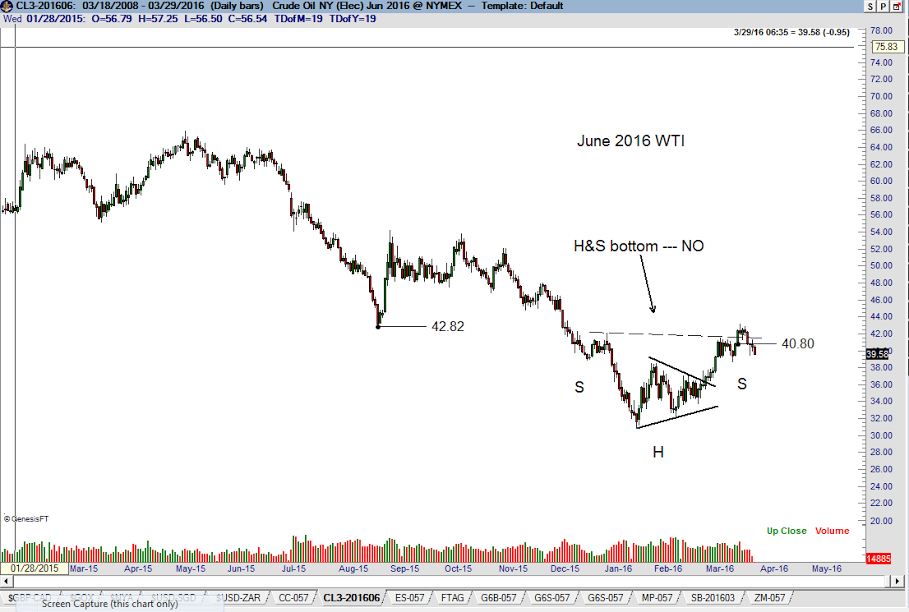
Factor Alert – March 30th
Factor Alert – March 30th
NOTE: This is a sample report that members of Peter Brandt’s Factor Service receive on a weekly basis. To consider membership, please visit this page for further details: Factor Membership Option
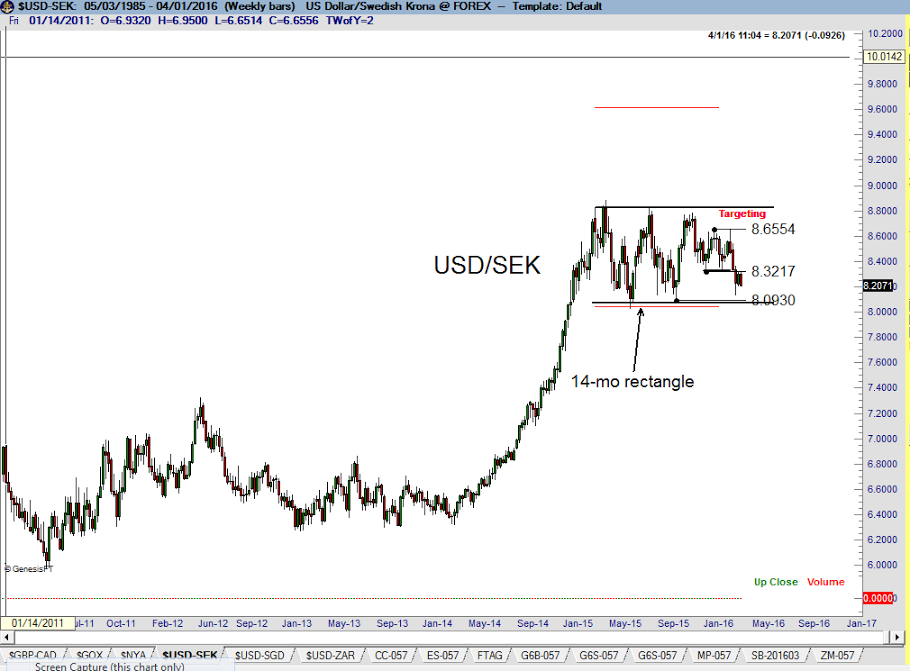
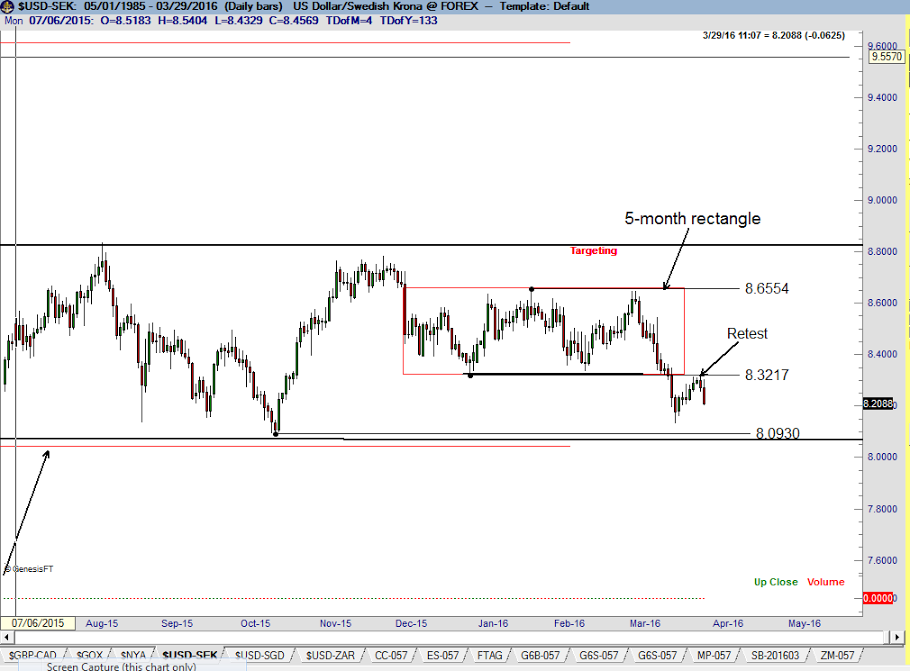
NOTE: This is a sample report that members of Peter Brandt’s Factor Service receive on a weekly basis. To consider membership, please visit this page for further details: Factor Membership Option

Hodge-Podge
Hodge-Podge

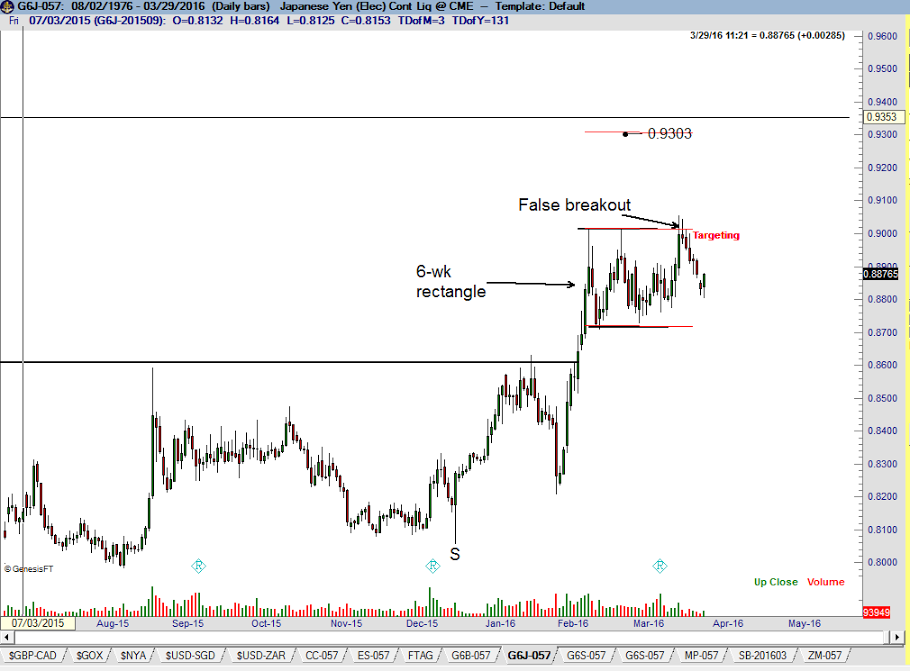
Factor Report – March 13th
Market Review
Factor Moves are currently ongoing in:- Gold
- Japanese Yen
- USD/NOK
- Copper
- AUD/NZD
Factor Moves in Progress
Copper (daily chart)
After falling from a high of 465 in Feb 2011, it appears that Copper bottomed at 193.55 on Jan 18. The advance on Mar 1 confirmed a H&S bottom. I have upped the initial price target to 231.90. An eventual test of the Oct 2015 high at 244 is likely. Factor is long one layer.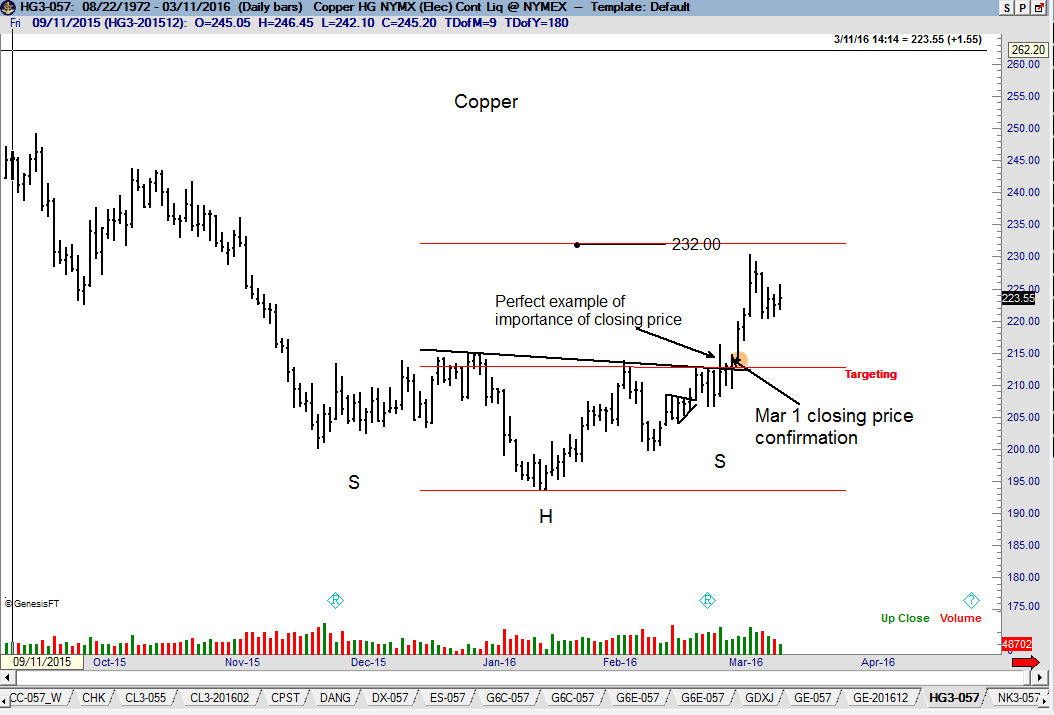 Read More
Factor Report – March 13th
Market Review
Factor Moves are currently ongoing in:- Gold
- Japanese Yen
- USD/NOK
- Copper
- AUD/NZD
Factor Moves in Progress
Copper (daily chart)
After falling from a high of 465 in Feb 2011, it appears that Copper bottomed at 193.55 on Jan 18. The advance on Mar 1 confirmed a H&S bottom. I have upped the initial price target to 231.90. An eventual test of the Oct 2015 high at 244 is likely. Factor is long one layer.
Read MorePeter Brandt’s Charting Tool
![]()
Peter’s Crypto Coverage

Recent Posts:
 Free ChartWizards Update July 1, 2026July 2, 2026 - 3:51 pm
 Factor Update, June 13, 2026 (Issued June 11, 2026) – Complimentary IssueJune 12, 2026 - 10:50 am
 FREE ChartWizards ETFs Update: Transports BreakoutJune 8, 2026 - 5:16 pm
- FREE ChartWizards UpdateMay 4, 2026 - 1:00 pm