The Public Blog site

Bottom-line Winners – Junk-Pile Trades

15% of my trades –
At the end of the year, these special trades are all that matter. These are the BOTTOM-LINER trades.

85% of my trades –
At the end of the year, the results of these trades just do not matter, but how they are managed matter much. These are the JUNKPILE trades.

Part 1 – Trading against expected metrics

As a trader I have always been interested (one might say “obsessed”) with data. I view myself as a data-driven trader. I am incredibly fortunate to have kept data on many aspects of my trading since founding Factor Trading Co., Inc. at the Chicago Board of Trade in 1981. This abundance of data provides me with a deep understanding of numerous benchmarks and metrics of my trading and risk management protocols. I did not begin collecting data thinking that someday the data would become extremely valuable in understanding the dynamics of a trading program – I collected the data because I have always loved data. Nevertheless, the data have become precious.

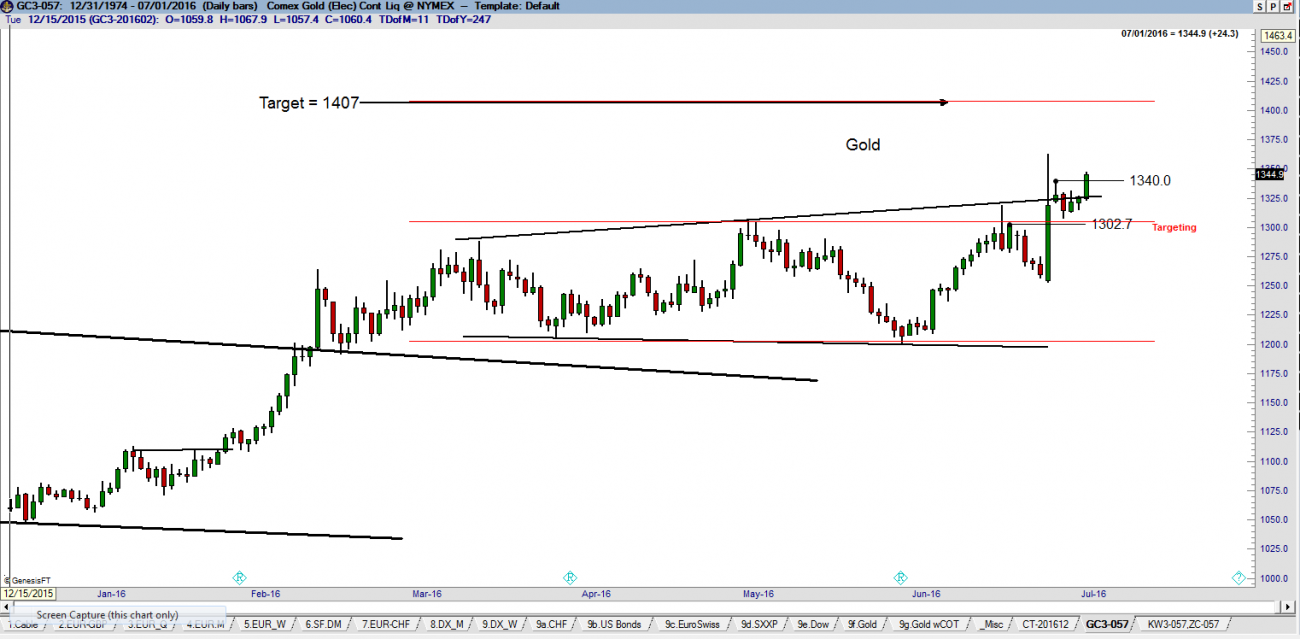
Since the inception of Factor I have remained primarily a classical chartist. Yet, the prism through which markets are viewed is one thing – actual trading tactics are an entirely different thing. While continually a chartist, my trading tactics have evolved through the years for various reasons (subject of another day). By tactics, I mean such things as:

  • Entry techniques
  • Time frames for market analysis
  • Expected holding time for trades – wins vs. losses Trading frequency
  • Risk management protocols
  • Sizing and leverage considerations
  • Trade management techniques and rules Order management
  • And, a host of other things

During the 1980s and early 1990s, I traded approximately 25 to 30 signals per month. From the mid-2000s through early 2014, I traded about 20 signals per month. Since early 2014, I have thought more in terms of trading themes than individual trading signals – in reality, I may have several signals in a given market under the umbrella of the same trading theme. My view of a “trade” is broader now than it was in the past. From early 2014 throughthe present I have been engaged in about 8 to 10 trades (themes) per month. My goal is to move toward only five themes per month.

How do I define a trading theme? This question is best answered by some recent examples. In my mind, long Silver and long Platinum were expressions of one trade, long Meal and long Beans were part of one trade and two attempts at long GBP were part of the same trade.

My profit goal is 35% per year – knowing that some years will greatly exceed this figure and losing years are possible. My goal is to move toward 50 trades per year. Let’s use the 50 trade figure as an example for a case study.

Based on my historical benchmarks, 50 trades will result in the following:

  • 21 trades (42% of all trades) will produce a profit
  • 8 trades (15% of all trades and 36% of the profitable trades) will produce the net bottom line (thus, I refer to these trades as “bottom-liners”)
  • 13 trades (21 minus 8) will be “lesser” profitable trades
  • 29 trades (58% of all trades) will be losers
  • Thus, for the 8 “bottom-liners” to represent the net profit, the 29 losing trades must be offset by the 13 lesser profitable trades

Let me translate the data above into basis point equivalencies. Remember, 100 basis points (BPs) equals 1% of total nominal trading capital.

  • 8 “bottom-liners” need to produce an average profit of 450 basis points (8 times 4.5% = 36%)
  • Assume the 29 losing trades will average minus 36 BPs, or a total of minus 1044 BPs.  Question –  How many of you have lost 10% of your trading capital in just one trade?
  • This means that the 13 “lesser” profitable trades need to achieve an average profit of 80 BPs to offset the 29 losers – and, thus, allow the 8 “bottom-liners” to produce the net result

Assume that I trade an average of 8 futures contracts per $1M of nominal capital. [Keep in mind that the actual size – depending upon the market traded and the specific chart set up – may range from 3 to 25 contracts per $1M of capital.] The equivalent size in spot forex would be a position valued at approximately $800,000 per $1M of nominal capital (even if the USD is not a pair within a specific forex trade).

Let me now translate this data into the USD result per futures contract (or spot forex equivalent as cited above).

  • The 8 “bottom-liners” must produce a profit of $5,600 per futures contract (or FX equivalent)
  • The 29 losing trades must be limited to minus $450 per contract (or FX equivalent)
  • The 13 “lesser profitable” trades must produce an average profit of $1000 per contract (or FX equivalent)

In my experience, there are only two tactical solutions to produce the data above:

  1. Let winners run – cutting winners prematurely would make it nearly impossible to achieve eight trades at 450 BPs each. Yet, certain persuasions are necessary to prevent winning trades from becoming “popcorn” trades.
  2. Aggressively advance stops on any trade that hesitates, thus “scratching” trades that could become 50 to 60 BP losers. Of course, in the process some potentially large winning trades might be jettisoned too early, but this is the trade-off I am willing to make to protect capital as Job #1.

Let me unpack item #2 above in more detail. A trade with an initial risk of 60 BPs (see Tracking Account spreadsheet for examples) represents a stop of about $750 per futures contract (or FX equivalent). My job as a trader is to shrink this potential loss as quickly as possible. To do so, I must attempt to adjust my risk level within a day or two after trade entry. The goal is to move stops to insure a break-even trade within a week.

Summary

I really want all Factor members to understand this concept – my real focus is the 15% of trades that hopefully establish a profitable bottom line at the end of a year. I refer to these as BOTTOM-LINE TRADES. This means that 85% of my trades are throw away trades – or, what I refer to as JUNK-PILE TRADES. This concept explains why an individual trade is relatively unimportant to me. An individual trade is simply a data point in a series of data points. It is unimportant if a trade is a profit or loss as long as:

  • It is based on chart configurations meeting certain standards
  • The leverage and trade management of the trade comply with predetermined guidelines
  • In other words, stick to the basics, focus on process and let profits take care of themselves


Factor Membership

This was Part one of a three part series, titled:  Bottom-line winners and junk-pile trades

Part 2 of this series focuses on Bottom Liners.
Part 3 of this series focuses on the Junk Pile of lesser profits and losers.

Part 2 and 3 are available to members of the Factor Service only.

Factor Membership is available.   For more information watch my 30 minute webinar where we cover the Factor service in depth.


Distribution of monthly RORs

Different approaches to trading should result in different statistical profiles. The graph below displays the distribution of the Factor’s monthly RORs over the years. The distribution of monthly RORs shown on the graph are very consistent with the summary of Factor’s trading strategy and tactics explained on the previous page.

  • A small percentage of trades (15%) producing the net profitability should produce a large right-handed outlier. This is exactly what the monthly distribution of RORs shows.
  • The most common month should be a small loser with the majority of trades (59%) being losers. This is exactly what the monthly distribution of RORs shows.


pile 1


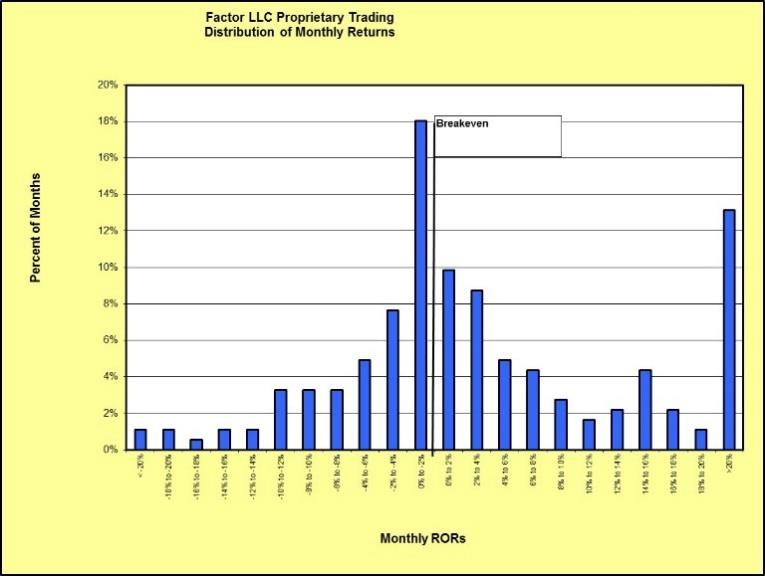
In an average year (keeping in mind that an average year is a statistical event – in reality, there are no average years), five months will be breakeven months (-2% to +2%), three months will be losing months (>-2%) and four months will be winning months (>+2%) of which one to two months will reside in the right-handed outlier column.

The profile of monthly RORs will be very different for different trading approaches. For example, short-term mean reversion trading approaches typically will not have right- or left-handed outliers, but will squeeze into the middle with the highest column being a small winning month.

Drawdowns

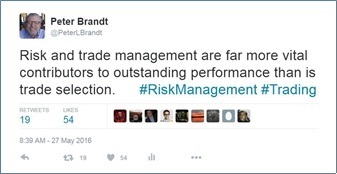
Drawdowns are an inevitable part of trading. There are some industry-accepted metrics related to the expectation of drawdowns for discretionary traders such as myself. Drawdowns must be taken into account when analyzing risk-adjusted performance.

The investment industry is obsessed with the Sharpe Ratio – which is, in my opinion and the opinion of most other proprietary traders I know – about the most worthless measure of trading performance invented by mankind. The fact the investment community is so obsessed with Sharpe is a confirmation of the lack of sophistication within the wealth management industry seeking to “manage” the capital of private investors. The best source of information on trading metrics can be found in Jack Schwager’s book, “Market Sense and Nonsense.”

There are two metrics I consider to be most important in appraising risk-adjusted performance – the Calmar ratio and the Gain-to-Pain ratio.


palmer


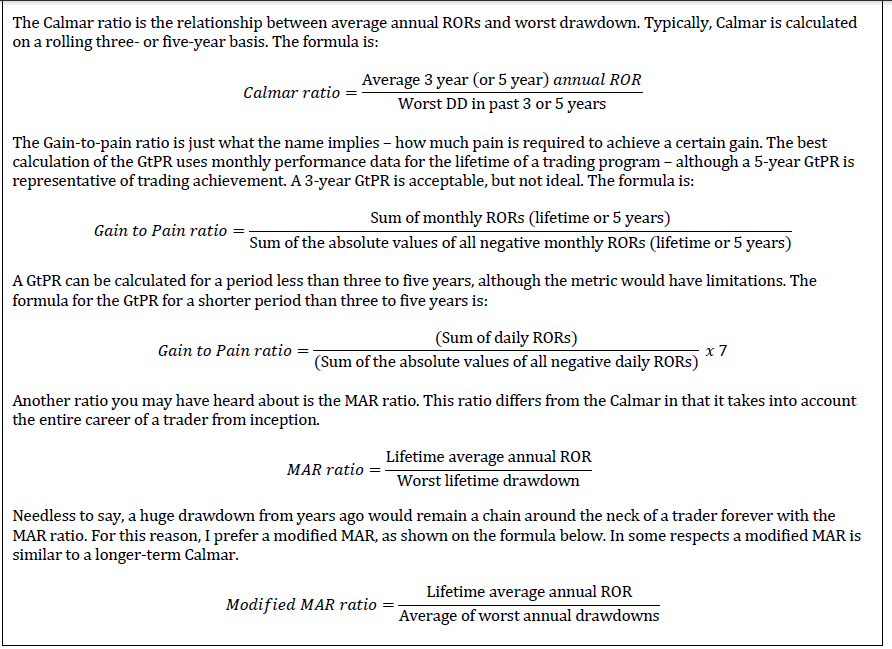
For both Calmar and Gain-to-pain ratios, a value greater than 1.0 is considered to be quite good, above 1.5 is considered to be very good, above 2.0 is considered to be excellent, above 2.5 is excellence-on-steroids, and above 3.0 is world class. Anything above 1.0 to 1.5 for MAR is excellent.

Based only on audited years, the Factor’s MAR is 1.3, modified MAR is 2.6, and GtPR is 2.5. Calmar is a metric that all traders should be aware of because it places upside performance into a proper perspective. A rolling Calmar of 1.5 (which is very good) suggests that a trader seeking a performance of 24% per year should expect annual drawdowns in the area of (16%).


pile 2

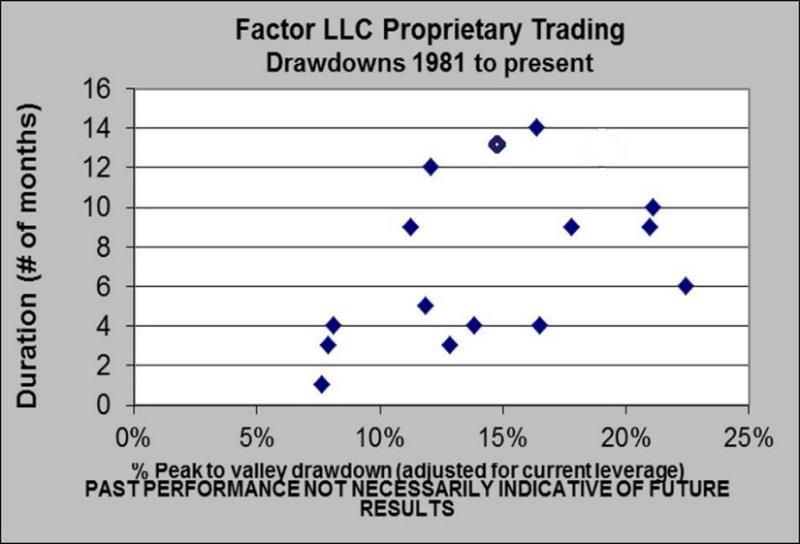
Drawdowns are the curse of a trader. I have been through many drawdowns in my career and they do not get easier. The challenge of a trader is to ride through these drawdowns, preserving both financial and emotional capital. To do so, a trader must constantly remained grounded in the foundational truths of his or her trading program.

Foundational truths include some of the following aspects:

  • Complete self-transparency and honesty (or, as near complete as is humanly possible)
  • Intimate knowledge of one’s trading program in all respects – trade signaling, risk and trade management
  • Knowledge of how one’s trading program should perform in different types of market environments
  • Statistical measurements to provide guidance as to whether a trading program is “going off the rails”

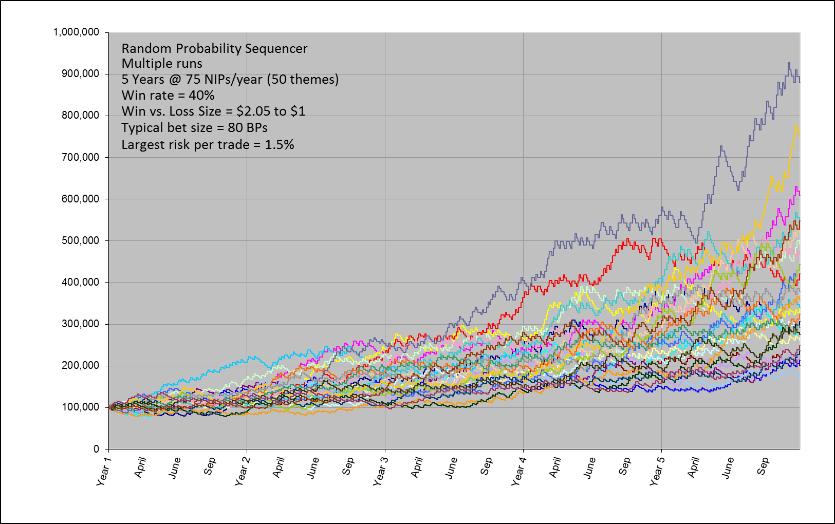
The longer a trader has traded a basic approach (allowing for some evolution along the way), the more intimate a trader will become with his or her trading approach and its moods and inclinations. I have a huge advantage on this score, having traded classical patterns for a living since 1981. I have both an instinctual and statistical sense of my trading approach. When N equals a large number (N being the number of trading events experienced by a trading approach), statistical benchmarks become more stable. My benchmarks are quite stable when projected over a multi-year time frame. The graph below displays a NAV over a five year period produced by a random-number generator. I have run thousands of sequences since being part of the small group of traders who developed the Excel program used to perform this analysis. The graph below shows only 30 sequences.


pile 3


Statistically I also know the probabilities of various drawdowns. For example, I know that annual drawdowns of approximately minus 9% to minus 17% have a probability within a single standard deviation. The table below is based on my historical benchmarks. I have made some changes in the past two years to trade management protocol in an attempt to push the skew of the STDs to the left. Exploration aimed at this goal continue.


stats


I completely understand that many of you do not have a solid grasp on the statistical probabilities of their trading approaches – and, in fact, too many Factor members do not even have a firmly articulated trading plan. This is why I encourage developing traders to go slow. Bet small, have realistic expectations and make capital preservation Job #1 until some of these other facets of trading gain clarity.


Factor Membership

This was Part one of a three part series, titled:  Bottom-line winners and junk-pile trades

Part 2 of this series focuses on Bottom Liners.
Part 3 of this series focuses on the Junk Pile of lesser profits and losers.

Part 2 and 3 are available to members of the Factor Service only.

Factor Membership is available and you could consider your membership in the Factor Service as just one more trade. If the Factor Service is not of value to you, well, it is just one more trade that did not work.   Through the Factor Service I endeavor to alert novice and aspiring traders to the many pitfalls you will face – and to offer advice on overcoming those pitfalls. My goal is to shoot straight on what trading is all about.  For more information watch my 30 minute webinar where we cover the Factor service in depth.

I hope you will consider joining the Factor community.

sig

###

Crude Oil Descending

Crude Oil Descending

Crude Oil is descending out of a triangle pattern.  The daily graphs show clear signs of topping in the energy markets. The daily graph of Sep RB Gas has completed an 11-week H&S top pattern with a target of 1.3237.


Crude Oil - Peter brandt - Factor


A couple of observations on daily continuation graph (true range) of Crude Oil are worthy of note. First, the 5-month up channel from the late Jan lows has been clearly violated. The breaking of an advancing trendline (lower boundary of a channel) is never a bearish signal in and of itself. Trendline breaks are simply an indication that the behavior of a market is changing. Second, the Crude Oil decline on Jul 7 completed a small descending triangle top with a target of 43.65, then 41.09. Factor is short Crude Oil.


Crude Oil - Peter Brandt - Factor

tweets - Crude oil - Peter brandt


Factor Membership is now available where trade setups such as Crude Oil are just one of numerous themes in focus each week.  You could consider your membership in the Factor Service as just one more trade. If the Factor Service is not of value to you, well, it is just one more trade that did not work.   Through the Factor Service I endeavor to alert novice and aspiring traders to the many pitfalls you will face – and to offer advice on overcoming those pitfalls. My goal is to shoot straight on what trading is all about.  For more information watch my 30 minute webinar where we cover the Factor service in depth.

I hope you will consider joining the Factor community.

sig


###

Silver and Gold Confirm Bull Market

Silver and Gold Confirm Bull Market

Silver and Gold have made some decisive moves of late.  It must be emphasized that the long-term trend in Silver and Gold is up.  I believe we are now witnessing a Silver Bull Market and a Gold Bull Market.  Despite the fact I have preferred the long side of Silver over the long side of Gold, I have grossly underestimated the power of this Silver trend. Thus, a reappraisal of the Silver chart is in order.

The advance on Jun 29 met the target of 18.52 established by the Apr 12 completion of an 8-month H&S bottom. As a result, Factor is now flat in Silver. This trade ended up as a 554 BP profit, thus establishing Silver as a qualified member of the 2016 Best Dressed List and a Bottom-Line trade for Factor.

Silver Bull Market

It is possible to interpret the strength in Silver this past week as the completion of a possible 33-month H&S bottom with an extremely abbreviated right shoulder. The target of this pattern is 22.40, although a retest of the 2011 and 2012 lows just above 26.00 is very possible.  I am most interested in buying a meaning correction in Silver, although I doubt that a hard retest of 18.00 (right shoulder high) will occur. Traders who focus on Fibonacci corrections should remain alert.


1


2

Gold Bull Market

The broadening pattern is typically reversal in nature. Very rarely will a continuation broadening pattern occur. The advance in Gold in early Feb 2016 completed a 16-month falling wedge bottom with a target of 1392, as shown on the first daily chart shown below.


3
The advance on Friday reconfirmed the likelihood that the broadening triangle is continuation in nature — with a target of 1407. Thus, the next target in the bull Gold market is in the 1392 to 1407 zone. Factor established a long position in Gold on Friday afternoon.


4


Factor Membership is now available and the Silver Bull Market and Gold Bull Market will be of prominent focus.  You could consider your membership in the Factor Service as just one more trade. If the Factor Service is not of value to you, well, it is just one more trade that did not work.   Through the Factor Service I endeavor to alert novice and aspiring traders to the many pitfalls you will face – and to offer advice on overcoming those pitfalls. My goal is to shoot straight on what trading is all about.  For more information watch my 30 minute webinar where we cover the Factor service in depth.

I hope you will consider joining the Factor community.

sig


###

Does the current CFTC COT Report forecast a decline in Gold prices?

CFTC COT (Commitment of Traders) Report Forecast a Gold Decline?

In recent past, I have cited the CFTC COT (Commitment of Traders) report's record open interest by large specs and record short open interest by commercials as a possible negative for Gold prices. Never one to trust myself, I decided to dig deeper to find out if my claim held water.
In fact, there is no recent evidence that such extremes in commercial shorts and large spec longs are negative factors on subsequent price action.
Read More

Always Consider Risk Management

Risk Management

Recent events only highlight the importance of Risk Management.  Late Thursday evening, and early Friday morning, I spoke by phone to many of the old-timers (some with near 50-year trading careers) in whom I have the highest level of respect. There was a universal consensus – we have never witnessed markets like those experienced over such a brief period of time. Even though I had almost no exposure, I stayed up into the late hours on Thursday evening watching in awe a broad level of volatility exceeding anything I can remember. There was, no doubt, some serious blood-letting. In the weeks ahead we will read and hear about some horror stories. More than one trading firm will announce bankruptcy. We will not hear about the hundreds of individual speculators whose accounts were destroyed.


Always Consider Risk Management - Peter Brandt


I want to revisit some of the themes I emphasize over and over and over again. Often times I feel that my harping on issues of Risk Management does not fully register with Factor members – especially newer traders who have not developed an adequate respect for market volatility.

As a general rule, I pay little attention to news events and the release of government reports. My view of Brexit was quite the opposite. I had no desire to carry any positions in the financial markets into Brexit with the hunch that things could get wild. I could not have imagined exactly how wild things would get. In recent Factor communications I expressed the view that holding a trade into Brexit was gambling, not calculated speculation.

Always Consider Risk Management - Peter Brandt


Several of my Factor members (see Premium option here) have asked me to clarify the difference between gambling and calculated market speculation. Hopefully you all now know the difference. In case the difference still evades you, try this on for size.

  • In calculated market speculation, a trader has some certainty that risk can be predetermined and
  • In gambling, a trader has no ability to predetermine and contain


Always Consider Risk Management - Peter Brandt


Allow me to review a few important principles.

  • Money management is job #1 for a trader.
  • Keeping your pile of chips intact is the only thing that really matters at the end of the day. (Risk Management)
  • If you think you know what a given market is going to do, you are only fooling yourself.
  • Trading a market with expanded volatility but reduced liquidity is a demonstration of arrogant insanity.
  • Being flat is a position.
  • An obsession to always be in the market will lead to disaster – it is only a question of when.
  • Being short volatility (short gamma) is akin to picking up pennies in front of a steam roller.
  • Of what value is market analysis and trade selection once a trader has lost his or her trading capital.

The volatile outcome of Brexit should remain burned into all traders’ memory as a reminder of how much damage can be done very quickly. Having an excellent way to analyze markets … refining trade identification techniques … using leading edge trading technology … etc., etc., etc. … none of these things hold a candle to capital preservation in terms of importance. In the final analysis, the only thing that matters is surviving to trade another day.


Factor Membership is now available.  You could consider your membership in the Factor Service as just one more trade. If the Factor Service is not of value to you, well, it is just one more trade that did not work.   Through the Factor Service I endeavor to alert novice and aspiring traders to the many pitfalls you will face – and to offer advice on overcoming those pitfalls. My goal is to shoot straight on what trading is all about.  For more information watch my 30 minute webinar where we cover the Factor service in depth.

I hope you will consider joining the Factor community.

sig


##


Brexit Exit Polling by Hedge Funds

Brexit Polling

The British government allows large hedge funds to conduct their own exit polling. They are not allowed to release their findings until 22:00 British Summer Time (BST) — there is no prohibition against their trading based on their own Brexit exit polling.
Properly sampled Brexit exit polling in UK voting is extremely accurate (usually within a +/- 1% error). Hedge funds will have a good indication on the Brexit vote by midday BST and will almost certainly have solid data by 18:00 BST. There is an embargo on publishing results until 22:00 BST. Thus, hedge funds will have a lead of many hours over the average market speculator.
The current betting odds is are 75% “remain.”
Brexit Exit Polling by Hedge Funds
[Note: My view is that a trader should not attempt to maximize profits on any given government report, event, day, week, month or even year — but to construct risk management practices geared to the longevity of market speculation over decades. Accordingly, I have covered all financially related positions.]
plb
###

Natural Gas Rising

Natural Gas Rising

The dominant chart construction in Natural Gas is the completed 7- month H&S bottom on the daily graph (Oct contract). Note the appearance of a possible 6-day flag on the Oct chart.  Factor is long Natural Gas and members were alerted of this buy with our premium reports section.

Natural Gas Rising - Factor Trading - Peter Brandt

The chart of the soon-to-be nearby Aug graph displays a pennant, not a flag (see below). The difference is that a flag is a diagonal correction while a pennant is a horizontal correction. A pennant is more constructive than a flag. That the nearby Aug Natural Gas contract displays a pennant while the Oct contract displays a flag is a constructive indication – in my opinion, for whatever that is worth.


Natural Gas Rising - Factor Trading - Peter Brandt


Factor Membership is now available.  You could consider your membership in the Factor Service as just one more trade. If the Factor Service is not of value to you, well, it is just one more trade that did not work.   Through the Factor Service I endeavor to alert novice and aspiring traders to the many pitfalls you will face – and to offer advice on overcoming those pitfalls. My goal is to shoot straight on what trading is all about.  For more information, visit the home page here.  Or watch my 30 minute webinar where we cover the Factor service in depth.

I hope you will consider joining the Factor community.


sig


##


Treasury Bonds (T-Bonds) are Constructive

Treasury Bonds (T-Bonds)

The dominant chart construction in Treasury Bonds (T-Bonds) is the 10-month symmetrical triangle completed on the weekly continuation graph in late Jan. The Sep T-Bonds futures contract has decisively completed a 4-month inverted H&S pattern on the daily graph. The advance this past week also completed the 4-month congestion zone on the daily continuation graph (not shown). Factor (see premium service here) is long the Sep contract. Stops have been advanced to just below Wednesday’s low.


T-Bonds - Treasury Bond Chart are Constructive - Factor Trading - Peter Brandt


T-Bonds - Treasury Bond Chart are Constructive - Factor Trading - Peter Brandt

Please forgive me for making a quasi-political statement. The behavior of the U.S. interest rate markets and the jaw-boning of the Fed are at TOTAL disconnect. This highlights two facts – the Fed is incompetent and totally out of control and Janet “The Felon” Yellon is way out of her league.  I have known more about U.S. Treasury rates as a chartist than has Yellon as Fed Chief.


Factor Membership is now available.  You could consider your membership in the Factor Service as just one more trade. If the Factor Service is not of value to you, well, it is just one more trade that did not work.   Through the Factor Service I endeavor to alert novice and aspiring traders to the many pitfalls you will face – and to offer advice on overcoming those pitfalls. My goal is to shoot straight on what trading is all about.  For more information, visit the home page here.  Or watch my 30 minute webinar where we cover the Factor service in depth.

I hope you will consider joining the Factor community.


sig


##


Coffee Futures are Brewing

Coffee Futures

Coffee Futures are brewing again.  Historically, the Coffee market has been a yo-yo — major Coffee bull markets followed by major bear markets, as shown by the quarterly graph. The market has been trading in an area of historical support.

Coffee Futures are Brewing - Factor Trading Peter Brandt 1


The weekly chart has been forming a rounding or complex H&S bottom. The right shoulder has taken the form of a symmetrical triangle.  Coffee continues to form a possible rounding bottom on the weekly graph. This bottom is forming in the area of likely historical support. I believe the advance last Friday was a classic Wyckoff Sign-of- Strength (SOS) day, meaning it could prove to be the launch for the completion of the bottom.


Coffee Futures are Brewing - Factor Trading Peter Brandt 2

The advance today has completed — at least intraday — the symmetrical triangle on the daily graph (red box).

Coffee Futures are Brewing - Factor Trading Peter Brandt 3
Pending a close above 135.30 a major bull trend will commence in Coffee. The most likely profit target is 160, or the area of the 2014 lows.
This is a HIGH RISK trade.
Coffee ETNs include CAFE and JO.
Coffee Futures are Brewing - Factor Trading Peter Brandt 4
Coffee Futures are Brewing - Factor Trading Peter Brandt 5


Factor Membership is now available.  You could consider your membership in the Factor Service as just one more trade. If the Factor Service is not of value to you, well, it is just one more trade that did not work.   Through the Factor Service I endeavor to alert novice and aspiring traders to the many pitfalls you will face – and to offer advice on overcoming those pitfalls. My goal is to shoot straight on what trading is all about.  For more information, visit the home page here.  Or watch my 30 minute webinar where we cover the Factor service in depth.

I hope you will consider joining the Factor community.


sig


##


Simple Trade Management

Simple Trade Management – Standing the Test of Time.

I have absolutely no control if the next trade or series of trades will be profits or losses. However, with a proper Trade Management process, I know that I only have control over:

  • The patterns I identify as trading opportunities – do they meet a certain standard?
  • The orders I enter – is my order entry processes consistent with conducting trading as an organized business enterprise?
  • Leverage and sizing – (Risk Management) am I risking too much, but also, am I risking enough to make a trade matter if I am right?
  • Ongoing Trade Management – am I taking the right balance between protecting capital and allowing a trade to fully develop?

I want to be able to look at past trades on a chart a year or more after the fact (both entry and exit) and be able to say – “YES, that trade made sense, my sizing was right, my trade management was precise.” Picture this concept: If I blow up charts to wall-sized and stick pins into price bars at every spot where I bought and sold, will the placement of all the pins make sense a year after the fact? If I look at a pin and say, “I have no idea what I was thinking in that trading action,” then I have some serious issues I must address in my trading operations. Food for thought?


Factor Membership is now available.  You could consider your membership in the Factor Service as just one more trade. If the Factor Service is not of value to you, well, it is just one more trade that did not work.   Through the Factor Service I endeavor to alert novice and aspiring traders to the many pitfalls you will face – and to offer advice on overcoming those pitfalls. My goal is to shoot straight on what trading is all about.  For more information, visit the home page here.  Or watch my 30 minute webinar where we cover the Factor service in depth.

I hope you will consider joining the Factor community.

sig


##