July Soybeans — A Chart Lesson

The chart of July Soybeans is very instructive for traders using classical charting principles (Edwards and Magee or Schbacker).

As a starting point, no two classical chartists may label a chart in the same way. And even if some classical chartists agree as to pattern identification, it does not mean that:

  1. The pattern will be valid and not morph into something different, or,
  2. The traders will trade the pattern using the same entry and exit strategy, sizing and leverage, etc.

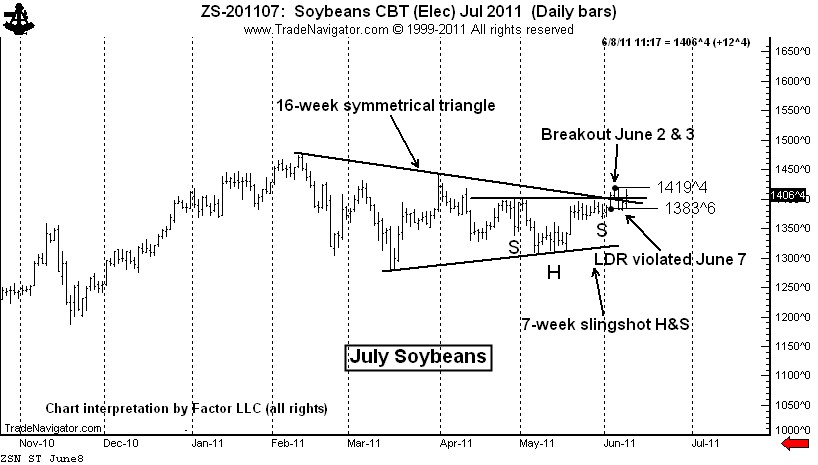
I had labeled the July Soybean chart as a 16-week symmetrical triangle. By the way, the morph rate on symmetrical triangles is quite high. Nevertheless, the pattern was mature enough that I bought the breakout on June 2 at 1402. My initial stop was based on my Last Day Rule principle (see Diary of a Professional Commodity Trader book for an explanation of this rule). The LDR price of 1383.6 was violated on June 7, stopping me out. I lost about 50 basis points on the trade.

I still have the chart labeled as the same symmetrical triangle, and view June 2nd and 3rd  as a premature breakout — although the breakout could prove to be a bull trap of significant magnitude. I will receive a secondary completion signal if the market can clear the June 3 high at 1419.4 or close above the upper boundary line of the triangle (about 1404). As of this writing, July Soybeans are trading at 1402, not high enough to trigger an entry signal. If an entry signal is generated at the close, the new Last Day Rule will be the low of today at 1385.

I will go long on a secondary completion of the pattern with a risk of 50 basis points (1/2 of 1% of capital). If I go long again and get stopped out, I will no longer follow this market. I give a pattern two chances for a clean breakout.

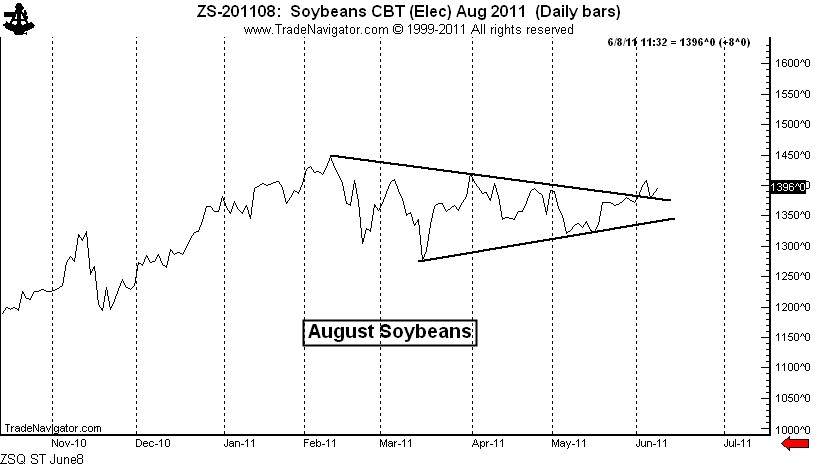
There is another lesson in this market. I have recently written about my dismay with high/low bar charts because of the noise factor. I have a strong bias in favor of closing price charts. On a closing price chart, August Soybeans completed the symmetrical triangle on June 2, but has not violated the pattern. A close below the May 31 close at 1372 would be required to violate the pattern.

Using closing price charts raises the subject of not using intraday stops, but rather using “stop-close-only” orders (real or mental). I discussed this idea in my blog posts titled “Lessons from a difficult year of trading” on May 24 and “Stops or no stops – a response to StockSage1” on May 25.

From a tactical point of view, using close-only stops (or much wider intraday stops) means that a trader must downsize his or her leverage or sizing in order to limit the risk of a trade to a certain basis point loss. Ideally, while the profit potential per winning trade would decrease with smaller sizing, the win/loss ratio would improve over an extended period of time in a manner to hopefully offset the lower leverage per trade.

Well, that’s my brain drain on this subject for now.

###

Another strike against intraday stops

It’s the line that counts.

Every thing else is noise and clatter intended to confuse and separate traders from their money. Where a market closes is all that matters.

My final thought for the weekend.

###

Latest member of the Hall of Shame

I plead with all you newcomers to trading, please don’t get caught in this trap.

Trading is hard work. There are no short cuts. Tuition is required, and the markets decide the amount of the tuition.

Yet, every year thousands of newcomers to trading get trapped by con artists such as the people behind this email ad. There is no such thing as a trading system that is accurate 88% of the time.

Enter scams such as this at your own risk.

P.S. The bottom of the ad, in tiny print, contains the sentence, “These trades were not actually executed.” That tells it all.

###

Stops or no stops – a response to StockSage1

Yesterday morning I posted “Lessons from a difficult year of trading.” The post detailed three major factors contributing to my current 13 percent drawdown and nine modifications I am making to my trading plan in response to the situation. All successful traders – discretionary and systematic – are constantly on the alert for ways to improve their trading operations.

One of the nine modifications was the following:

Modify my protective stop protocol to reflect increased intraday noise

I have always believed in having protective stop orders in place at all times. I am no longer a strong advocate for this practice. I have been stopped out of too many positions only to see better exit spots within hours or days. Rather, I am now an advocate of the following protective stop protocol.

  1. No stops in overnight markets, including forex
  2. Mental stops based on closing price charts – the use of mental stops requires disciple to follow through with intentions
  3. Very wide actual stops (daytime session) to protect against a “worst case scenario

My friend and peer, Robert Sinn at The Stock Sage responded to my post almost immediately with an excellent piece titled, “The Evolution of a Professional Trader – Stop Loss or No Stop Loss?” Read Robert’s post here.

Robert Sinn, The Stock Sage

Robert is one smart trader and seldom misses a beat. Robert, very wisely, makes the following point:

 “I believe that the use of stops is absolutely essential in short term trading. A trade should have a defined target objective which in turn requires a defined risk. It is too easy to talk oneself into moving a mental stop in the middle of a trade, therefore, using a hard stop (placed shortly after the trade is entered) is optimal over the long run.”

In a subsequent back-and-forth email exchange, Robert suggested that I more fully explain the thinking behind this modification. Great suggestion! So, here it goes.

Stops are essential in trading. Novice and emerging traders should NEVER trade without a protective stop. NEVER! I agree with Robert that using a hard stop is optimal over the long run.

The modification I am making is a rather nuanced one, as I will explain with three points and a chart example.

First, it is important for you to know that I seldom trade a leveraged futures or forex position (although the total value of all my positions combined at any given time will exceed my account value). For example, for each $1,000,000 of account value I am likely to limit a trade to four contracts of Comex Gold, 300,000 to 400,000 EURUSD or ten contracts of Corn, just to provide a few examples.

Second, I traded for decades when overnight markets were not even available – and my performance during those years was actually superior to my performance since 24-hour markets began. I can remember being awakened in northern Minnesota in the middle of a summer night by a thunder bolt, and wondering, “Is it raining in central Illinois…how will Beans open tomorrow?” I begin trading spot forex in the early 1980s, but did not pay any attention to overnight cross rates (except for the Yen) until 2007. I was in the Crude Oil market at the start of the Gulf War. I was in a Gold position on 9/11 when the Towers were hit. I survived these events just fine without 24-hour markets.

Sure, not having an order in the overnight markets will result in an occasional hit. But, I am convinced that the risk is worth it – especially considering the fact I am not leveraged in any given market.

Third, my focus on closing prices is very consistent with orders that were once common place in the good-old days of the exchange trading floor. The electronic exchange has taken flexibility away from traders. How unfortunate! For example, one order I used extensively was an “OCO,” or “one cancels the other” stop, with one component being a hard stop and other component being a “close-only” stop. Here is a real example of how this would have worked in a recent trade.

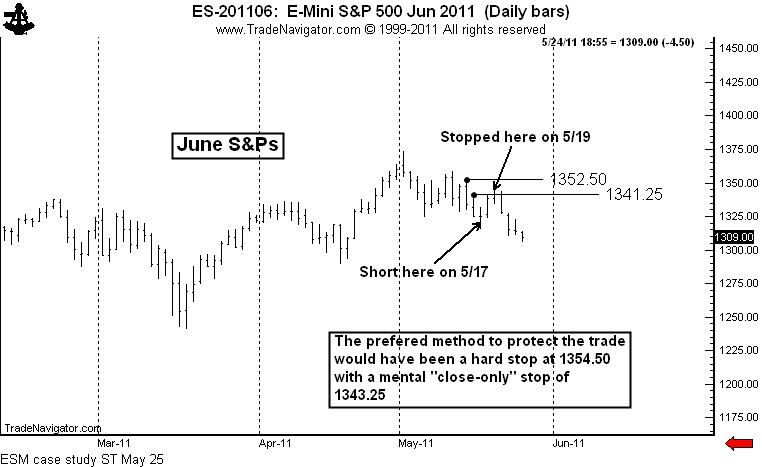
I shorted the June S&Ps at 1323 on May 17. I always place protective stops a few points above the high of the bar I use to protect a trade. The bar I used for the stop was the May 16 bar, which had a high of 1341.25. My stop was placed at 1343.25. I was stopped out on May 19.

However, my preferred order would have been to place a “close-only” stop against the May 16 bar and a hard stop against the May 13 bar. In the good-old days my stop-loss order would have read…

  • “Buy 10 June S&Ps at 1353.50 stop OCO buying 10 June S&Ps at 1343.25 stop-close only, one cancels the other.”

This order strategy would have kept me in the trade. In a very real sense, this modification of my protective stop strategy is a roll-back to earlier days intended to nullify intraday noise. I will lose more money in those trades in which I am dead wrong on direction, but I will keep from getting chopped up in many more trades.

Yet, I completely agree with StockSage1 in principle that the use of stop-loss orders, all other things being equal, is a must in trading.

###

Lessons from a difficult year of trading

This correspondence details lessons I have learned about myself, my trading and the markets as a result of a difficult year of trading.

Perhaps these lessons can benefit you, especially if you are a discretionary trader who uses chart patterns for trading.

I am not shy about hyping my good trades. I am also not hesitant to point out my unprofitable trades as well. In fact, traders who know me best would say that I am much more inclined to discuss my struggles than my victories in trading.

Touting only profitable trades is a violation of full disclosure because profitable trades are not representative of overall trading performance. On the other hand, an analysis and discussion of the trials and tribulations of trading can produce trading insight. In fact, I believe that the best thinking by traders occur during periods of adversity. It is during these periods that traders think most deeply about their trading and risk management protocols and practices, about market behavior and about the human dimension of market speculation.

I am presently experiencing a quite unpleasant 12-month period in the markets. It has been Chinese water torture. I have been forced to go back to the drawing board to re-examine every aspect of my trading.

Background

First, some perspective is in order.

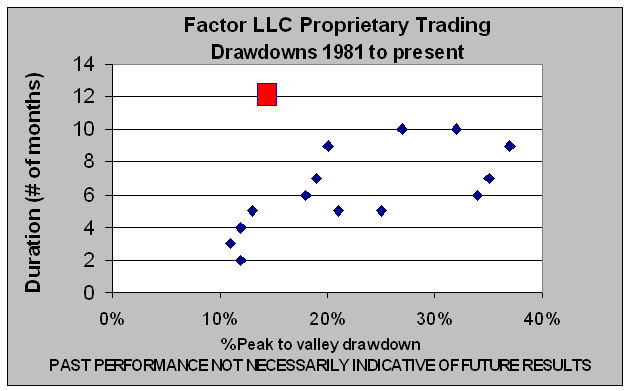
Coming into 2010, I had three pretty good years of trading. In 2007, my trading account gained 95 percent (due mostly to Gold). I was up 59 percent in 2008 (EURUSD and GBPUSD). Then, 2009 was an okay year with a 24-percent gain (due almost exclusively to a mid-year Sugar move). I had a fair first four months in 2009, up about 7 percent, but trading has been a struggle since then. I am in a 12-month drawdown of around 13 percent. The peak-to-valley magnitude of this drawdown (marked by red box) has been mild by historical standards, but the duration has been a 30-year record. The scatter graph below displays all my drawdowns in excess of 10 percent.
 

I have had some excellent trades in the past 12 months, but they have been too few and far between. As I stated earlier in this correspondence, this past year has been like Chinese water torture…drip…drip…drip! Of all the drawdowns I have encountered over the years, this one has without a doubt been the emotionally toughest to endure.

Since 1981 I have experienced more drawdowns than I can remember – at least two in excess of 5 percent every year I have traded. I have survived every drawdown. I have no doubt I will survive this drawdown – and that I will emerge as a better trader.

As has always been the case with drawdown periods, I attempt to ask (and hopefully answer) three questions.

1. Has my trading plan/guidelines/rules been out of synch with the markets?

  • If so, in what ways? Has the drawdown uncovered some basic flaws of the plan? [Note: Basic flaws in trading plan are masked during profitable periods – they show their hand during drawdown periods.]
  • What modifications could I make to address foundational flaws of the trading plan, not to optimize the plan against the recent time period, but to improve upon the plan. [By the way, I am not a believer in the optimization of indicators.]

2. Has the basic behavior of the markets changed?

  • If so, might the change in market behavior be permanent?
  • If permanent, what might be the reasons?
  • If permanent, what are the implications for the trading plan?

3. Has my trading execution been out of synch with the plan? (Note: this applies more to discretionary traders than to systematic traders.)

  • If so, in what ways has my execution been out of synch with my trading plan?
  • Have there been any particular patterns in the breach of the trading plan?
  • What changes are needed to bring execution back into line with the plan?

As I analyzed the past year, the answers to the three questions are YES, YES, and YES. My analysis attributes a percentage contribution to trading results by each item. Perhaps in a future post I will address the attribution analysis.

Over short periods of time nothing can really be done to address #1. All trading plans are cyclical in terms of their alignment with market action. Addressing foundational flaws of a trading plan is an ongoing effort for all traders. This is a healthy and needed process.

But a “Yes” answer to item #2 is a more complicated matter. I believe the basic behavior of markets has changed permanently. See my blog post here for my thinking on this matter. Yet, I also believe that my solutions for items #1 and #3 will address the changing nature of the markets.

Action plan

The bottom line issue for me is simple – What changes do I need to make to my trading plan (and the execution of the same) and to my risk management protocols to return my trading plan to consistent profitability? Without going into depth on each item, the following represents my action plan. Some of these items represent modifications, some new twists and some a rededication to basic principles.

Focus on charts from an elevation of 40,000 foot

Daily chart patterns have become increasingly unreliable. In fact, the changing nature of the markets (especially in forex and futures) has almost made shorter-term patterns things to be faded. This means that I will not look at an intraday chart and only look at a daily chart if the weekly or monthly charts have given me a reason to do so. Fortunately, the weekly and monthly charts have not been compromised by changes in shorter-term market behavior.

Decrease risk per trading event

My historical maximum risk per trade has been 100 basis points, with the entire position entered at once. I have readjusted this maximum risk to 60 basis points, with positions being established in halves or thirds.

Avoid range-bound markets

The past year has greatly reinforced the concept of “markets at rest remain at rest and markets on the move remain on the move.” I have lost a significant amount of capital in the past year anticipating breakouts that did not occur.

Be much more aware of the underlying trend

Defining “trend” can be a difficult challenge, but I have begun monitoring some moving averages – not in the sense of developing or using a moving-average trading system, but as a proxy for trend. A majority of the chart pattern trades that have cost me money in the past year have been countertrend (as measured by the moving average proxy).

Transition away from high/low/close bar charts to closing price charts

“Noise” has increased in my primary markets (futures and forex). I have had way too many orders executed at intraday price extremes, only to have the markets close at prices favorable to my trades. The most important price of the day is the closing price. The most important price of the week is Friday’s close.

Modify my protective stop protocol to reflect increased intraday noise

I have always believed in having protective stop orders in place at all times. I am no longer a strong advocate for this practice. I have been stopped out of too many positions only to see better exit spots within hours or days. Rather, I am now an advocate of the following protective stop protocol.

  1. No stops in overnight markets, including forex
  2. Mental stops based on closing price charts – the use of mental stops requires disciple to follow through with intentions
  3. Very wide actual stops (daytime session) to protect against a “worst case scenario”

Actively trade a portion of a position

Historically, I have held onto my entire position until the target was reached or until the initial protective stop was hit. This strategy has not treated me well during the past year, and, in fact, has negatively impacted my bottom line for the past two years. Rather, I have adopted a strategy to hold half of a position while trading half of a position, selling only on strength and buying only on weakness.

Avoiding ambiguous market situations

As a discretionary trader (as opposed to a systematic trader), there are always market situations that fall into a grey zone – “is there a set-up or isn’t there a set up?” I have historically erred on the side of giving a set-up the benefit of doubt, believing that I would benefit if just one in four questionable set-ups worked. My theory has been that making money is more important than being right. I have reappraised this trading strategy in favor of demanding more clarity from chart patterns. I still believe that making money is far more important than being right — but with less reliable chart patterns, erring on the side of caution is now part of this belief system.

Limit my decision-making time window

I have long had a rule to determine and enter my orders each afternoon and then avoid exposure to the markets during the trading session. At the same time, I love the markets and, like so many other traders, get caught up in the price-making process. The degree to which real-time decision making has negatively impacted my bottom line really hit home in the past year. I am NOT a good intraday trader – never have been, never will be. Paying attention to the markets during the trading session is detrimental to my financial (and emotional) health.

Another aspect of intraday decision making is worthy of note. There was a time in the markets when the trend of the first several hours would continue through the day. This is no longer the case. Directional price momentum during one time slot seems to have no correlation to momentum in subsequent time slots. Markets now routinely make new highs and lows frequently throughout the day.

Let me close this post with one other thought. I am in a drawdown. Yet, I am in no hurry for a new NAV peak. I have seen too many traders blow-up by “doubling up to catch up.” I can only control what I can control – but profitability during any given time period is not a controllable variable.

That’s it for now, folks.

It’s as easy as “ABC” – classic H&S failure in Corn

Often a pattern failure tells a better story than does a pattern completion.

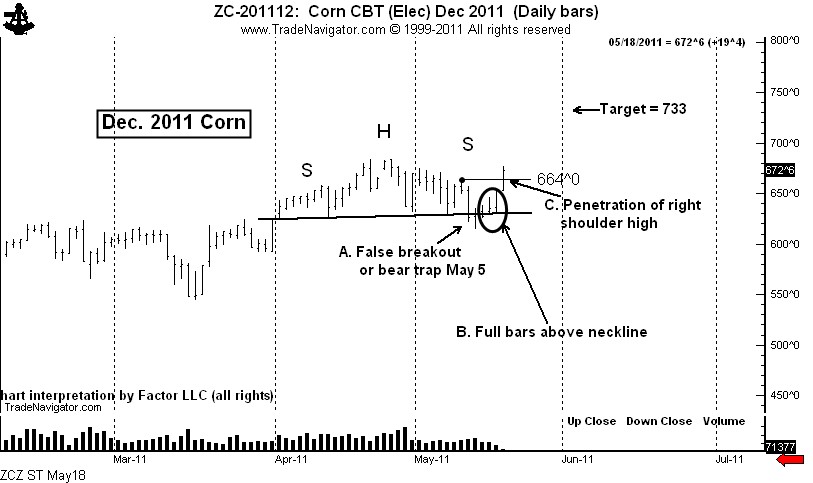
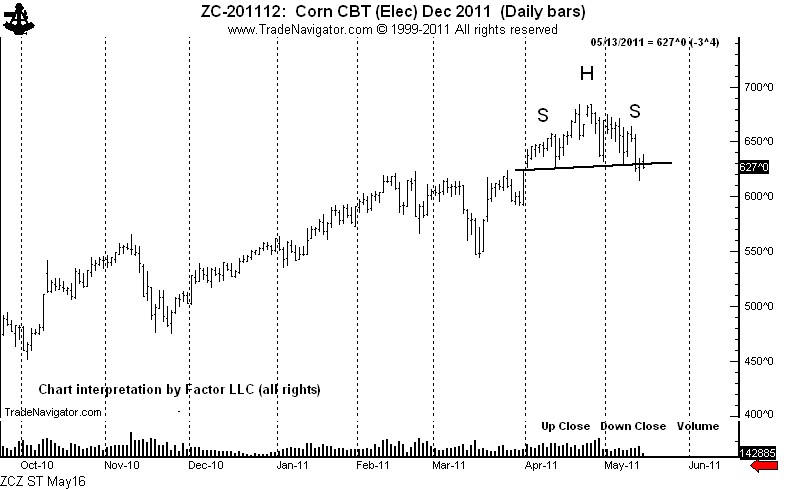
This is just what we have in the case of new crop December Corn. As of last week it appeared that Dec. Corn was forming a H&S top pattern. On Wednesday, May 11, the market completed the top pattern (the “A” in the story). On May 12, the market had a minor upside reversal, but remained below the neckline. On May 13, the market poked back above the neckline intraday, but closed below the neckline. Then on May 16 the market spent the entire day above the neckline, followed by a strong gain on May 17. This is the “B” in the story and confirmation that a bear trap had been sprung.

I consider H&S failure patterns to be very tradable chart developments. The advance today, May 18, penetrated the May 10 right shoulder high and officially completed the failure pattern. This is the “C” in the story. Support should be solid at 664.

The target of 733 is based on projecting the distance between the April 26 high and the May 12 low (which is 69 cents) upward from the right shoulder high of 664. The market should probably not take out Wednesday’s low (652-3/4).

###

Flags flying at half-mast – a sign of death!

 Risk On – Numerous charts show signs of a pending decline 

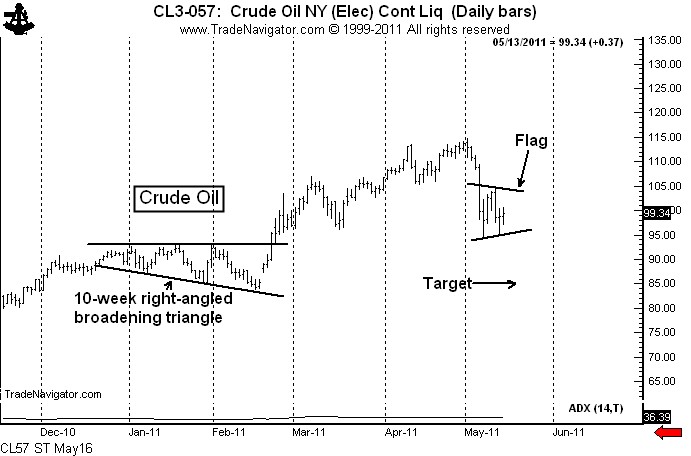
In the markets, as in real life, flags flying at half mast symbolize death. A number of half-mast flags and pennants in the raw material markets indicate that the steep decline in early May was just Act 1 in a two-act play. The flags are symbolic of the intermission between the Act 1 (the first decline) and Act 2 (the next phase of the bear trend). 

Bear flags or pennants are present in the following markets

  • Crude Oil
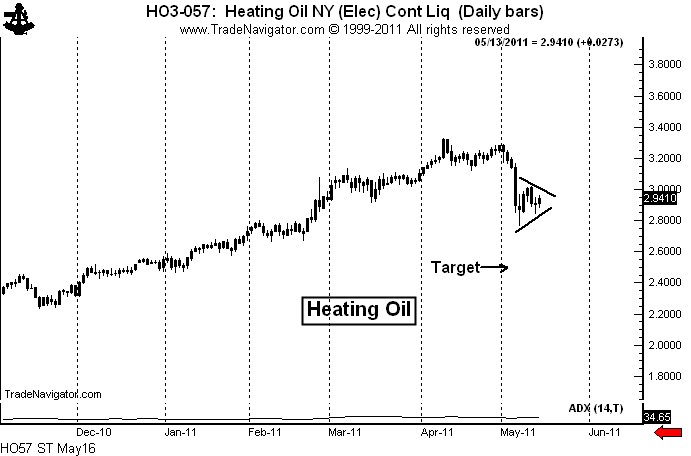
  • Heating Oil
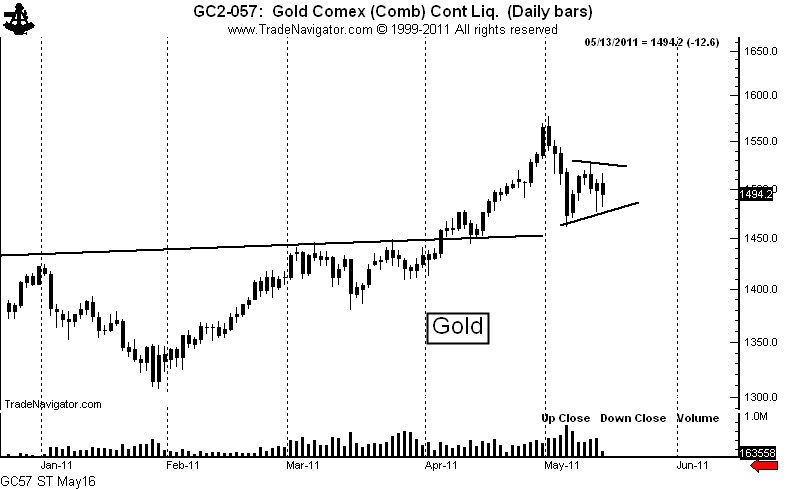
  • Gold
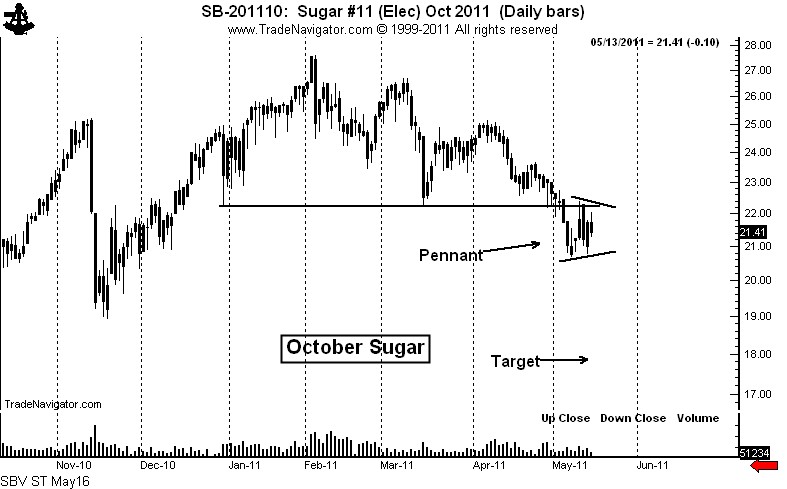
  • Sugar
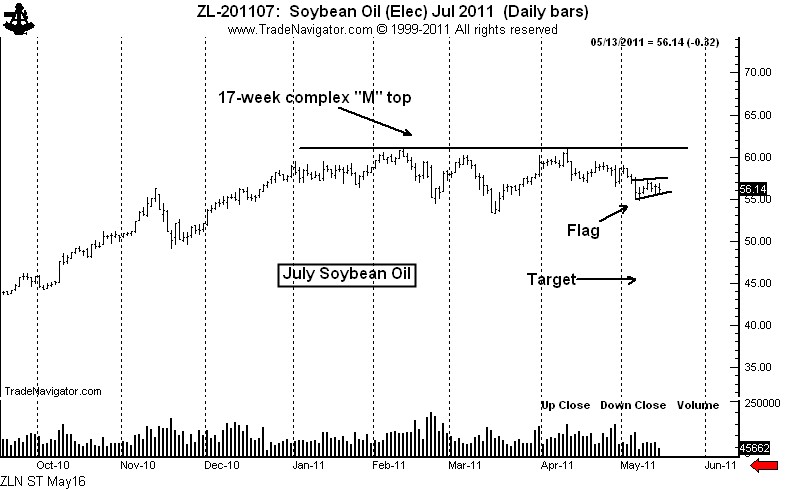
  • Soybean Oil 

Crude Oil and Heating Oil display classic pennants. Rallies toward the May 11 high (while not necessary) would be an excellent shorting opportunity. The target of the pennant is Crude Oil is 84.80.  

The target in Heating Oil is 2.5060.

The Gold displays chart construction similar to the energy products with two exceptions. First, there is potentially enormous support under the Gold market in the form of a previously completed 4-month continuation inverted H&S pattern. However, old support sometimes has a way of disappearing. Second, the huge volume on May 5 could indicate accumulation buying by strong hands. However, if the energy pennants lead to a strong decline it will be difficult for Gold to hold up in a Risk On/Risk Off market environment. 

Sugar also displays a classic bear pennant. This market is in a well-established bear trend and has been since early February. Notice that the pennant in the October contract is forming just below the neckline of a 5-month H&S top. The target in October Sugar is 17.83. 

If my analysis is correct in Soybean Oil, the current pause in the form of a flag should be the last support before a sustained markdown in price. Once this flag gives way, prices should trend to 45.60. (Caveat: The pattern in Bean Oil could prove to be an extremely bullish continuation H&S pattern. Traders need to be flexible on this one.) 

Additionally, a number of other markets present technically bearish potential. These markets include:

  • Russell 2000
  • S&P 500
  • Silver
  • Corn
  • Soybean Meal

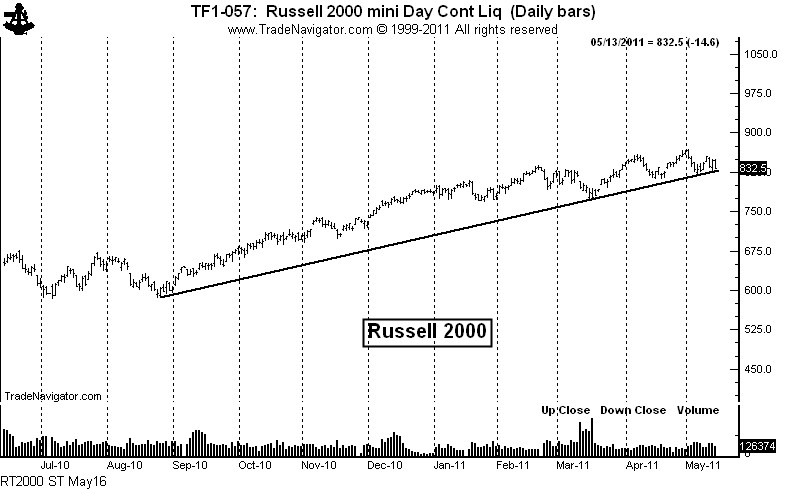
The Russell 2000 is hovering right at the major 8+ month trendline. A violation of this trendline would indicate that the bull trend since March 2009 is seriously aging. The initial target would be 770 as part of the transition from bull market to bear market. 


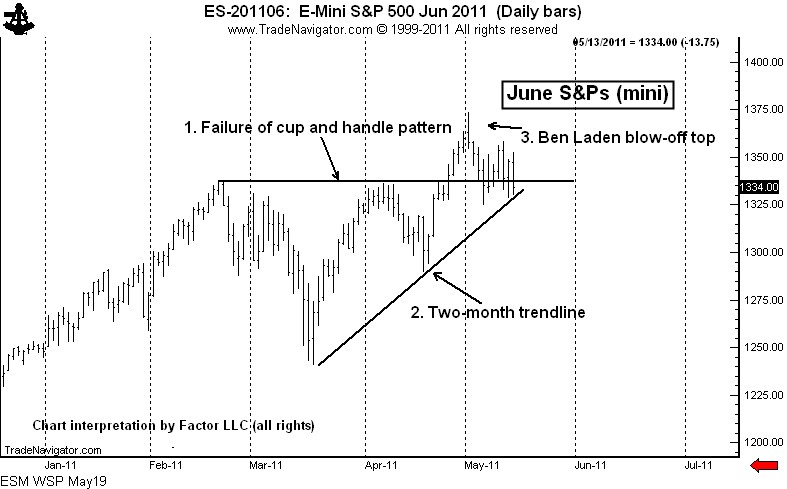
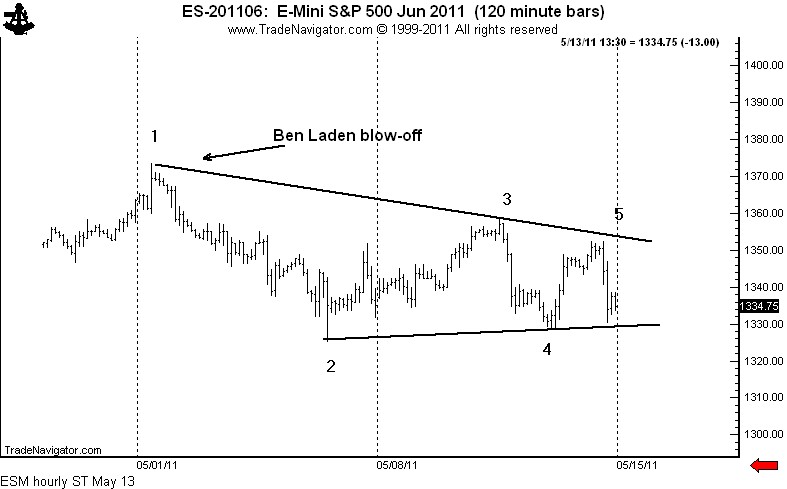
A confluence of technical developments can add to the legitimacy of a breakout. There are four factors that could trigger a sell signal in the S&Ps simultaneously by a decline below the May 6 low. First, the 2-month cup and handle bottom would fail; second, the 2-month trendline would be violated; third, the May 2 Ben Laden blow-off would be confirmed;

and, finally, the hourly chart symmetrical triangle would be completed. 

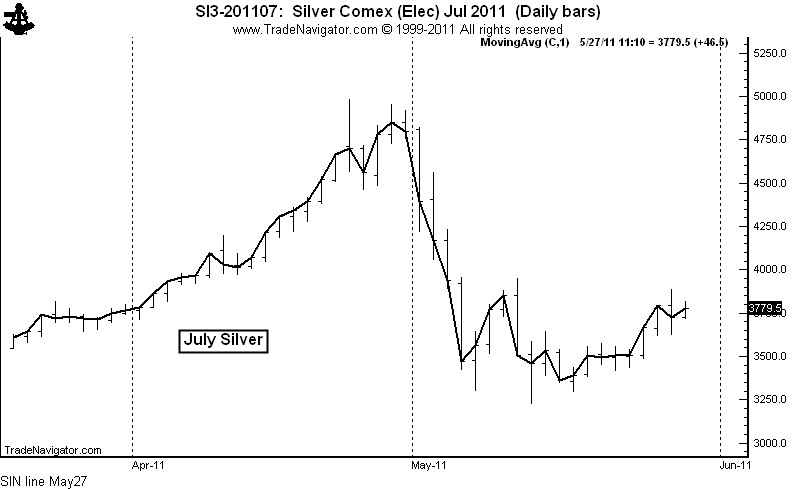
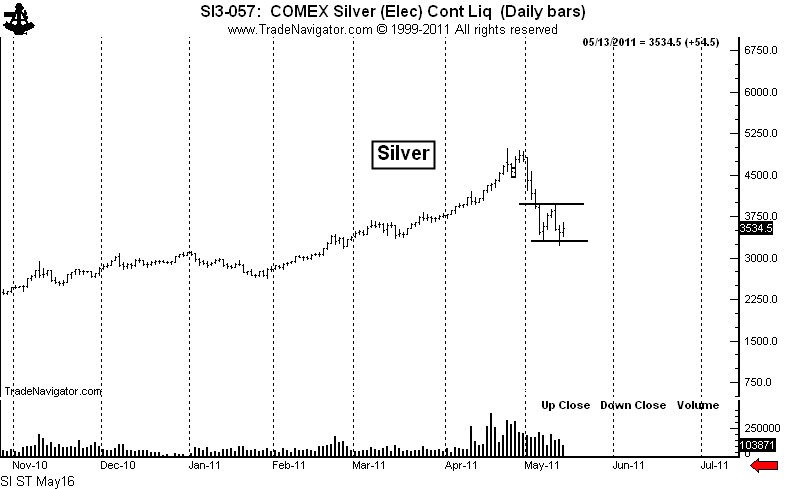
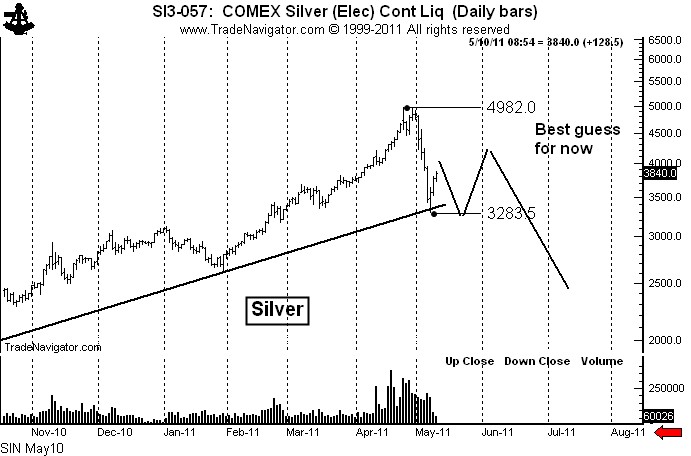
I touched the third rail in late April when I announced that Silver was in the bubble phase. I was tarred and feathered on May 1 when I pronounced the previous week’s volume (7.5 years of global supply) was a strong sign that Silver had topped. The market has found support in the low 30s and a bounce into the low 40s is possible as Silver develops its own half-mast bear pattern.

New crop December Corn has traced out a H&S top. It would not be unusual for Corn to top now.

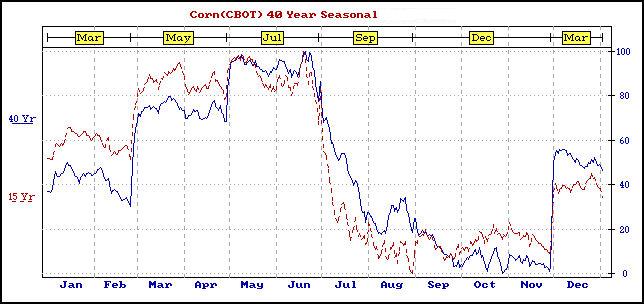
The seasonal chart shown indicates a strong tendency for new crop Corn to top in May or June.

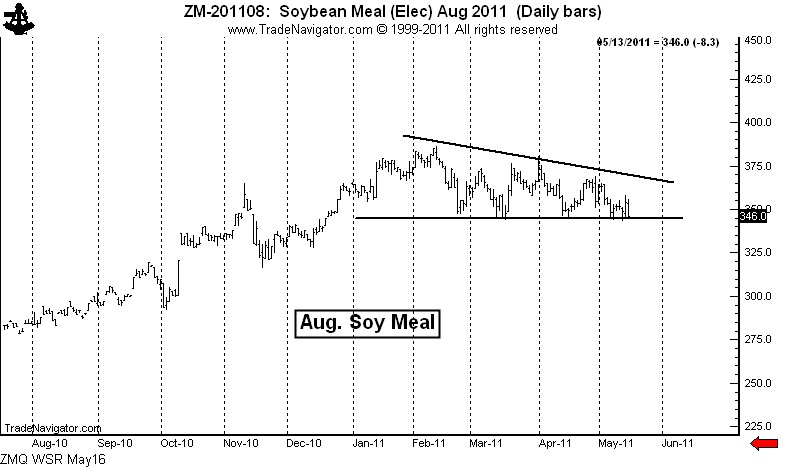
Finally, the daily chart of August Soybean Meal displays a very clear possible descending triangle. A close below the recent lows would complete this pattern and establish a target of 300.

Adding all things up, the period just ahead could be a tough life for raw materials (and stocks).

###

What Now, Silver Cow?

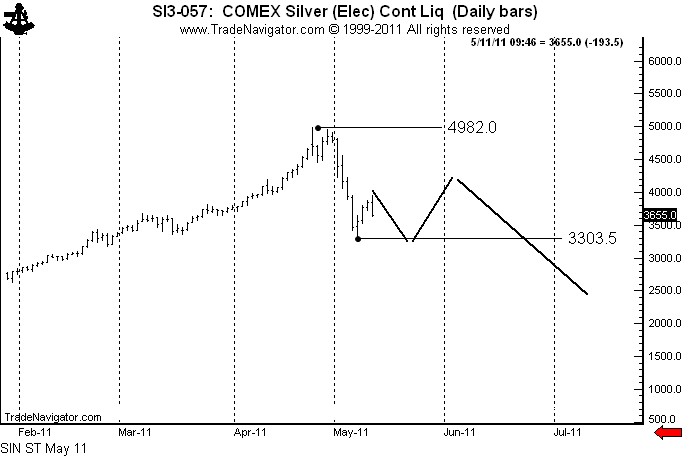
Just for fun, yesterday I did a snarky post on a very short-term “pie-in-the-sky” forecast for Silver. I called for the bounce to stop between 39 and 42 (actual high was 39.47) followed by a decline to below 33, then a rally to 42. The lines on the chart below were drawn yesterday morning.

So far so good. Pure luck…if I am right it will be pure luck. A wild guess! A hail-mary pass! I admit it. Of course, I am far from right yet. Alot can happen. The Silver market (and any other market) can do anything it wants to do whenever it wants to do it and it would not surprise me. The Silver market is NOT accountable to my whims or wishes or wild guesses.

I had a number of folks challenge my forecast, wanting to know on what technical or chart basis I would come to such conclusions.

I have no idea if I will be right — like I stated above, I was taking a wild swing in the dark — but I will share with you my reasoning (right or wrong).

My price scenario was based purely and soley on what I thought the market had (has) to do to most severely punish Silver bulls, more specifically, Silver bulls that are long above 40 per oz. My secret is out! I have told it all. My market call had NO basis in technical analysis. Period! My career as a classical chartist is over. I have sinned against my craft. I created a scenario that was based on what I thought the Silver market could do to most demoralize the johnny-come-lately Silver bulls.

I could have also created a price scenario of what I think the Silver market could do to most severely punish the Silver bears. Perhaps I will share this in the days to come. Perhaps a “punish-the-bears” scenario is the real agenda of the Silver market.

The truth be told, I could care less which scenario comes to pass. I have no vested interest in Silver. I am a trader. I trade price, not market biases, not fundamental scenarios, not Fed doomsday events, not the future value of the US$. And by the way, the last time I checked the U.S. Dollar is not traded in the Silver pit. Never has been. Never will be. There is an actual contract for trading the Dollar.

That’s all for now, folks.
###

Silver – What’s next short term?

Most chart patterns fail and then morph into larger patterns in a process I call “redefinition.” This is especially true of intraday charts. They are extremely unreliable.

With this in mind, here is my best guess on the short-term chart structure of Silver.

On the daily chart, a major top is in place. I keep hearing people talk about waiting for a decent break to buy  — about catching the next upleg in the market. Unbelievably, many “investors” are still bullish on Silver. To me this is a gigantic red flag. Conventional wisdom (i.e., the prevailing view of the marketplace) holds that Silver is in a significant correction within a much larger bull trend. The bias of investors (those not wiped out by the first decline) is to be long.

What we know for certain is that a parabolic move ended in massive record volume in Silver trading (futures and ETFs). This is a sign of a top. The burden of proof is on the bulls. In fact, should the market rally and make a new high it would be one of history’s great shorting opportunities. People have attempted to convince me that Silver was not in a parabolic move. WHATEVER!!!!!

Make no doubt about it, Silver has topped. If it has not topped, it will be many, many months before a legitimate bull trend can re-emerge.

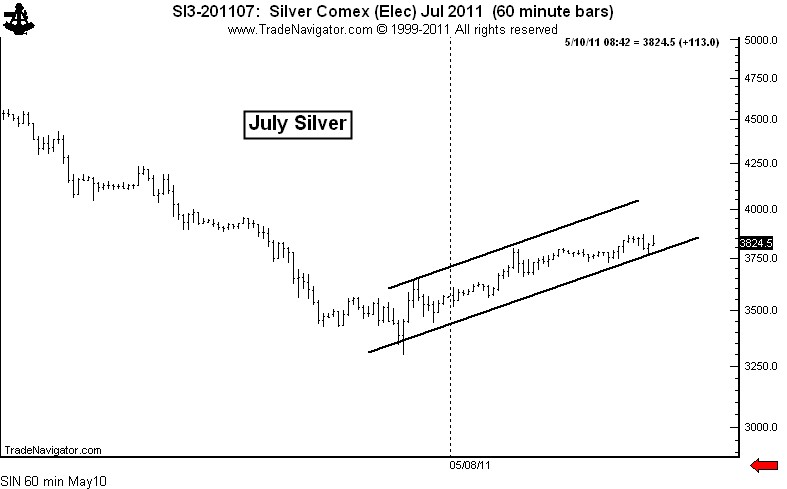
Short term, the hourly chart displays an advancing channel. I believe that a bear market correction to the $39 to $44 zone is possible, but not on this leg up.

More than likely the market will have a further downward correction, perhaps even making a new low for the decline, before a more serious rally into the low 40’s can occur. From a market psychology standpoint, a decline to the low 30’s followed by a rally into the low 40’s would get the bulls all excited again — just in time to be slammed once more.

Then the market should drop into the mid 20’s.

Full disclosure: I have no position. I have no bias to defend. I don’t really care where Silver goes. I am perfectly ok if Silver goes to 5 or to 100. I don’t care if my next trade is short or long. I only care that sometime in the next 12 months the Silver market will give two or three low risk/high reward chart setups.

###

Silver — history repeating itself

Three reasons why Silver might be close to a temporary bottom (within a larger bear market).

  1. There will be support at the trendline from August and January lows. Today could end up as a reversal day.
  2. Small investor may be washed out — this is needed for a rally to occur. SLV had record volume Thursday at 294 million shares. More volume than SPY. This volume represented small investors liquidating, not accumulating. The buyers were people who took profits last week. Sorry, small investors, this is the way the raw material markets work.
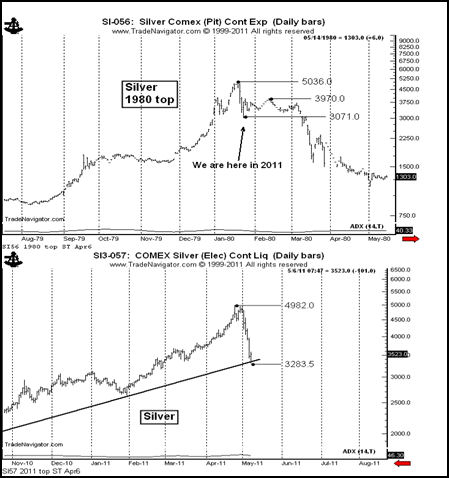
  3. The top in 1980 would indicate a rally from here. The rally should not exceed $39 to $42. Do not be confused — Silver is now in a bear market.